Changelog

Follow new updates and improvements to FTO.

August 18th, 2026

This update brings a wide range of new indicators and analytical tools, expanded futures and prop trading capabilities, improved charting and drawing workflows, new API capabilities, and numerous fixes across the platform.

✨ New Features & Improvements

πŸ“Š Indicators & Analytical Tools

  • BigTrade β€” added a new indicator for detecting large trades on futures instruments.

  • YMWD High/Low β€” added a new indicator showing Year, Month, Week, and Day high/low levels.

  • ICT Killzones & Pivots β€” added a dedicated indicator for working with ICT-based trading approaches.

  • Ichimoku β€” added Kumo cloud transparency and separate colors for bullish and bearish clouds.

  • Cumulative Volume Delta (CVD) β€” added a new indicator for analyzing volume and the balance between buying and selling pressure.

  • Footprint β€” improved the indicator's behavior and display at high testing speeds.

πŸ“ˆ Trading, Futures & Prop Trading

  • Two-Phase Challenges β€” improved support for two-step Prop Challenge scenarios and their conditions.

  • cTrader History Import β€” added support for importing trading history from cTrader.

  • Futures Position Size β€” fractional position sizes are now prohibited for futures both at the application level and through the API.

  • Futures Journal β€” the trading journal now displays both Original and Adjusted prices.

  • New Order Window β€” added the ability to dock the order window to the right side of the screen with Dock To Right.

🎨 Interface & User Experience

  • Chart Synchronization β€” charts can now be synchronized by the Data Range (time range) between windows.

  • Design System β€” updated interface colors and visual components across the platform.

  • Drawing Tools β€” added a new Highlighter tool and expanded line-width support for Brush.

  • Crosshair β€” added settings for crosshair line style and thickness.

  • Weak / Strong Magnet β€” improved magnet behavior with two magnet strength modes:

    • Strong Magnet snaps to the nearest suitable point without a distance limit.

    • Weak Magnet keeps the behavior of the previous magnet mode.

    • Drawing tools can now also snap to visible indicator buffers on the main chart.

  • Jump to Date β€” improved default date values and quick editing actions.

  • Favorite & Speed Panels β€” panel positions are now saved locally. Panels remain where you left them and are prevented from disappearing outside the screen when the window size changes.

  • Sync Crosshair β€” added the ability to disable crosshair synchronization.

  • Text Tab β€” redesigned the Text tab in drawing tool settings.

  • Modify Order Hotkey β€” added a keyboard shortcut for opening the Modify Order window.

  • Commissions β€” commission fields in symbol settings now support fractional values.

  • Project Sharing β€” users who have not purchased FTO can now access shared projects in view mode.

  • Magnet Mode Hotkeys β€” Ctrl+Alt+M now toggles the magnet mode, while holding Ctrl temporarily enables the magnet without changing its selected strength.

  • Favorite Tools Panel β€” added right-click actions for drawing tool icons, including Move Left, Move Right, and Remove. Also added the Hide Favorite Graphic Tools Panel command.

🧩 API & Custom Indicator Development

  • OnChartEvent β€” added a new method for handling mouse and keyboard actions in indicators.

  • MT4 Indicator Functions β€” expanded the indicator API with additional functions, including iMACD, iEnvelopes, and others.

  • Graphic Tools API β€” added the ability to create drawing tools programmatically.

  • Line Parameters API β€” added separate API parameters for line color, style, and thickness.


🐞 Bug Fixes

πŸ“‰ Charting & Rendering

  • Critical Chart Tools Fix β€” fixed an issue that could prevent drawing tools from working and cause the chart to freeze.

  • Heiken Ashi β€” fixed candle wick calculations and improved consistency with other indicators.

  • Graph Tools β€” fixed an issue where rectangles were shifted by one bar on H1 and higher timeframes.

  • Zoom Behavior β€” fixed incorrect Min/Max display when zooming in heavily.

  • MacBook Trackpad β€” prevented unwanted chart zooming when scrolling with a trackpad.

  • Footprint β€” fixed issues with payload updates, marks, and zone highlighting.

  • Rectangle Border β€” fixed incorrect rectangle border rendering when Extend is enabled.

  • Bars Display β€” increased the visual spacing between bars and aligned the gaps between them more consistently.

  • Previous Levels β€” fixed an issue where the indicator did not display all available levels at once on H1 and higher timeframes.

  • Multi-Chart Sync β€” fixed incorrect symbol and timeframe synchronization behavior for the first chart in a multi-chart layout.

  • Crosshair Display β€” fixed an issue where the crosshair could remain attached to a bar if the mouse was not moved during testing.

  • Drawings & Indicators Visibility β€” improved the Show/Hide behavior so it no longer overrides individual object settings or causes newly added drawings and indicators to remain hidden.

πŸ“‚ Project Loading & History Import

  • Project Loading β€” fixed an issue preventing projects containing cross-symbols from loading.

  • History Import β€” improved timezone handling and symbol mapping, including instruments such as XAUUSD.

  • Oscillator Window β€” fixed an issue where the oscillator window size was not preserved after leaving a project.

  • Custom Timeframes β€” indicators added to a chart are now automatically applied to custom timeframes as well.

πŸ“‰ Indicators

  • SMA β€” fixed an issue with indicator rendering when switching between futures symbols.

  • Round Numbers & Psychological Levels β€” fixed an issue where these indicators were not displayed correctly when being added to a chart.

πŸ’Ή Trading Operations & State Recovery

  • Order Recovery β€” fixed issues with order restoration after Bar Back and project reloading.

  • Pending Orders on Futures β€” fixed incorrect pending order prices after using Bar Back.

  • Order Panel Visibility β€” fixed an issue where the order panel remained visible after closing a trade.

  • Reward-to-Risk Sell β€” fixed input fields in the Sell version of the tool.

  • Trading Journal Screenshots β€” fixed an issue that could cause screenshots to disappear from journal entries.

  • Futures Backtesting β€” improved futures testing in Back-Adjusted mode. Positions are now automatically closed at contract rollover, while opening/closing markers and the connecting position line are displayed correctly.

πŸ–₯️ Analytics, UI & Stability

  • Datepicker β€” fixed automatic closing behavior after selecting a date.

  • Indicator Panel Focus β€” improved focus behavior when hovering over the indicator panel.

  • OHLC / Data Panel β€” reduced the delay before updated values appear in the data panel.

  • Project Loading β€” fixed a Chunk is null error that could occur in certain project-loading scenarios.

  • Analytics Tab β€” fixed incorrect values displayed for Days Processed and Months Processed.

  • Rollover Popup β€” redesigned rollover information so it is now displayed on mouse hover instead of requiring a click.

  • Robot Toast Notifications β€” disabled order-opening toast notifications while Robots are running.

  • Go To β€” the Custom Date field now displays the current date and time of the selected chart.

  • Project Loaders β€” updated the design of project-loading indicators for a cleaner and more consistent experience.

July 15th, 2026

This update introduces powerful new analysis tools, expands futures trading and backtesting capabilities, adds Custom Timeframes, and delivers multiple usability and stability improvements across the platform.

πŸ“ˆ CME Futures and Backtesting Logic

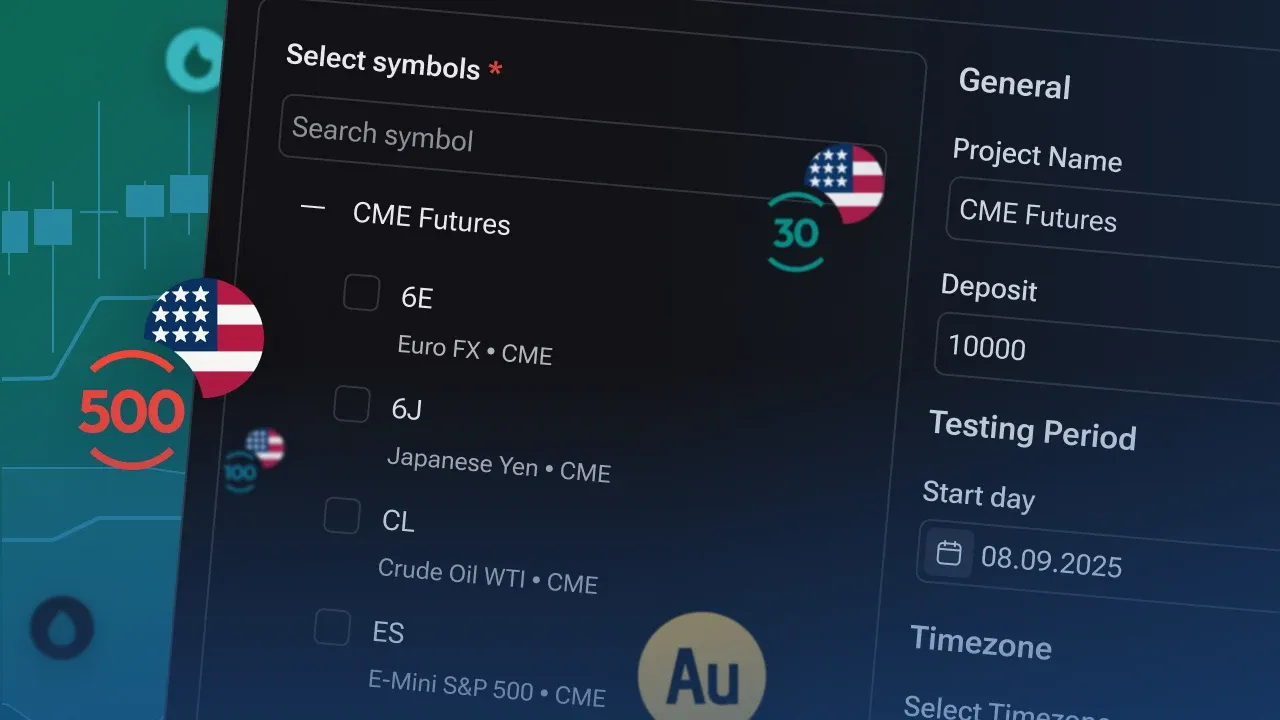
  • Added support for official CME data for backtesting using Continuous Contracts.

  • Charts can now switch between Original Prices and Back-Adjusted Prices.

  • Added proper tick-based calculations and measurements for futures instruments.

  • Trade results and PnL values now automatically use the correct units depending on the instrument type.

  • Added contract rollover markers directly on futures charts.

  • Added quick switching between Back-Adjusted and Original Prices with optional chart synchronization.

  • Futures order prices now always respect the instrument’s minimum tick size.

πŸ”’ Partial Close Improvements for Futures

  • Fractional lot values are no longer allowed in the Partial Close dialog for futures instruments.

🏷️ Updated Futures Instrument Descriptions

  • Updated naming and descriptions for CME Futures and CFD Futures instruments to improve navigation and symbol discovery.

πŸ“‚ Improved Symbol Tree

  • Added automatic section collapsing.

  • CME Futures and CFD Futures are now grouped separately for easier navigation.

πŸ“ˆ New Indicators & Analytics

πŸ‘£ Footprint Indicator

Added the new Footprint indicator for detailed volume and order-flow analysis within individual candles.


⏱️ Custom Timeframes

πŸ†• Custom Timeframes Support

Added support for Custom Timeframes.

You can now create and use custom chart intervals starting from H2 and above, providing greater flexibility for market analysis and strategy testing.


🎨 User Experience Improvements

πŸ’Ύ Floating Panel Position Persistence

Floating panel positions are now automatically saved to local storage and restored when reopening the platform.Β 


🐞 Bug Fixes

πŸ“‰ Market Data & Charts

  • Fixed a historical data discrepancy affecting EURUSD H4 and higher timeframes from November 1, 2020, ensuring better alignment with TradingView data.

  • Fixed an issue where outdated queued ticks could be processed after using chart seek/navigation functions.

πŸ“‹ Chart Templates

  • Fixed an issue where a chart template could stop working after being assigned as the default template and later replaced by another default template.

  • Fixed opacity settings not being applied correctly from templates via the context menu or tool panel.

πŸ”§ Drawing Tools

  • Fixed an issue where the hidden state of the Jump To button on horizontal lines was not preserved between timeframe changes or project restoration.


⚑ Stability & Performance

  • Improved futures trading workflows and partial-close behavior.

  • Improved chart template reliability and consistency.

  • Enhanced persistence of user interface settings across sessions.

June 18th, 2026

This release contains a major round of charting, performance, and workflow improvements. We've also resolved a wide range of issues affecting testing, project loading, and day-to-day platform usage.


🎨 Charting & Performance

  • Refreshed chart rendering for a crisper and cleaner appearance.

  • Optimized chart performance for smoother interaction and reduced lag.

  • Improved zooming behavior, allowing faster access to the desired zoom level while maintaining smooth navigation.

  • Enhanced candle rendering at high zoom levels with thinner, better-centered wicks.

  • Improved price scale labels with better sizing and spacing.

  • Better text positioning and readability inside chart objects during resizing.

  • Cleaner Fibonacci level labels with unnecessary trailing zeros removed.

  • Redesigned chart context menu for faster access to key actions.

  • Chart context menu is now available on mobile devices and tablets.


πŸ“Š Trading & Analytics

  • Updated Exit Optimizer in Advanced Analytics with a clearer layout and improved comparison of current versus recommended values.

  • Added a new Opening Gaps indicator capable of displaying daily, weekly, and monthly gaps.

  • Introducing Smart Lot: it can suggest more practical lot sizes based on the instrument and trading context.

  • Improved order price inputs: behavior is more predictably when you edit values, including cleaner step-based changes with the mouse wheel.

  • Added Select All / Deselect All options for timeframe selection in indicators and drawing tools.

  • Fixed bugs in the Average Trade Profit block in Analytics


πŸ›‘οΈ Stability & Reliability

  • Added automatic chart recovery when projects open without saved chart data.

  • Improved project recovery after temporary server limits or failed data restoration.

  • Fixed several issues that could prevent projects from opening after restarts or on subsequent days.

  • Resolved intermittent startup and interface errors.

  • Fixed rare crashes related to drawing tool interactions.

  • Fixed an intermittent endless data-loading state during testing in some cases.


⏩ Backtesting & Simulation Fixes

  • Improved Bar Forward and Bar Back behavior when data gaps are present.

  • Fixed an issue where Bar Forward could include an extra tick from the next candle.

  • Corrected higher-timeframe bar distortion when stepping backward during testing.

  • Fixed premature highs and lows appearing on daily and weekly candles during simulations.

  • Resolved severe slowdowns during testing on certain large bars.

  • Improved date navigation reliability when working with symbols that have different history lengths.


πŸ“‰ Chart & Indicator Fixes

  • Charts now refresh immediately after switching symbols.

  • Multi-symbol charts now remain properly aligned when symbols have different amounts of historical data.

  • Fair Value Gap (FVG) rectangles are now removed correctly when stepping backward.

  • Round Numbers and Psychological Levels indicators now update correctly even when the latest bar is outside the visible area.

  • Thin chart lines now render more sharply and accurately.

  • Drawing tools remain correctly attached to their respective symbols.

  • Double-clicking an indicator label once again opens its settings.

  • Hidden order history markers no longer respond to hover interactions.


πŸ€– Trading Tools & Automation Fixes

  • Automations now work correctly with custom indicators.

  • Fixed timeframe logic when creating additional strategies.

  • Indicator-based alerts no longer interfere with project loading after being triggered.


πŸ–₯️ User Interface & Experience

  • Added manual keyboard input for date and time fields.

  • Interactive tutorial videos are now available in more dialogs and workflows.

  • Added Japanese-language support for interactive videos.

  • Context menu actions are now displayed only when relevant.

  • Left and right sidebars now extend cleanly to the bottom of the screen.


πŸ”§ Other Fixes

  • Save shortcuts now work correctly with Japanese keyboard layouts.

  • Move To Last Bar is working correctly.

  • Improved synchronization between Go To Price values and chart markers.

  • Watchlist values now update immediately after adding or switching symbols.

  • Symbol names are displayed correctly after canceling robot attachment changes.

  • Help and Changelog badges now appear correctly after a page refresh.

May 11th, 2026

We’ve released a major update with a strong focus on chart stability and performance.

In this release we focused on stabilizing:

  • overall chart performance

  • indicator behavior and responsiveness

  • eliminating delays when timeframe switching

  • general smoothness during usage.

Here is what`s new:

πŸ”§ Features

  • Round Numbers Indicator β€” added a new indicator for key round levels

  • Balance Price Range Indicator β€” new tool for analyzing price balance

  • Market Structure Shift (MSS) β€” a new indicator that identifies the point at which a previous trend ends and a new one may begin.

  • Inverse Fair Value Gap (IFVG) β€” indicator that signals a potential price reversal or serves as a zone for opening a position or taking profits on an open position.

  • Sharpe & Sortino Ratios β€” added to analytics for performance and risk evaluation

  • Duplicate Orders β€” ability to duplicate orders (similar to Forex Tester 6)

  • Resources Section β€” new section with tutorials and educational content

  • Add Note Hotkey β€” new shortcut: Ctrl/Cmd + Alt + N

  • Save All Charts in Project β€” all charts (including closed ones) are now saved with objects

πŸš€ Improvements

  • Improved indicator performance and reduced memory usage

  • Optimized ADR indicator (fewer recalculations)

  • Timezone list now reflects backtesting time shift

  • Fixed indicator list auto-opening behavior (mono/multi-chart)

  • Dynamic Bid/Ask label colors for better readability

  • Improved sidebar and Favorites logic

🐞 Bug Fixes

πŸ“Š Charts & Testing

  • Fixed missing date scale after refresh (multi-chart)

  • Fixed crashes when switching to Dashboard

  • Fixed infinite loading in multiple scenarios:

    • timeframe without data

    • blocked chart layer

    • bar back on empty symbols

  • Fixed replay freeze after β€œJump To” custom session

  • Fixed incorrect jumps when testing W1 via H1

  • Fixed time gaps between bar chunks

  • Fixed TP/SL being skipped inside candles (large bar step)

  • Fixed issues with session navigation (special characters)

  • Fixed project restore after β€œGo To” start

  • Fixed incorrect RCI calculation

  • Fixed volume issues at large zoom out

  • Fixed slow Y-axis scrolling

  • Fixed incorrect chart scaling from journal orders

  • Fixed Max Drawdown updates

🧲 Drawing Tools

  • ESC now properly deselects tools

  • Fixed hotkeys (Horizontal Ray, Line, Vertical Line, Brush)

  • Fixed visibility sync across charts

  • Fixed visibility settings via context menu

  • Fixed disappearing rays in ray-based tools

πŸ“ˆ Exit Optimizer

  • Fixed pip calculation for XAUUSD / GOLD

  • Added:

    • correct pip size

    • global ATR

    • improved SL/TP ranges

    • holding duration scaling

πŸ’Ύ Projects & Indicators

  • Projects now save even if a custom indicator is missing

  • Fixed custom timeframe in drawing tools

  • Fixed indicator list behavior when switching layouts

UI/UX Fixes

  • Close / Maximize buttons now appear on hover (multi-chart)

  • Updated UI for drawing tools (modals, menus, fonts, spacing)

  • Settings windows improvements

  • Fixed invisible error text in dark theme

  • Updated selected tools colors

  • Improved indicator settings & oscillator display

  • Fixed markers for Horizontal Ray / HLine

  • General chart UI polishing

πŸ”Œ API

  • GetOrderOpenTime / GetOrderCloseTime now return FTODate

  • Fixed text overlapping (anchor = bottom/related)

  • Added oscillator plotting on main chart

April 7th, 2026

New Tools, Smoother Workflows & Major Fixes

This update brings a mix of new trading tools, smoother workflows, and important fixes across charts, analytics, and UI. We’ve focused on making your experience faster, more intuitive, and more consistent.

πŸ”§ New Features & Improvements

πŸ“ˆ New Drawing Tool: AVWAP
Added Anchored VWAP (AVWAP) β€” a powerful tool for tracking volume-weighted price from any point on the chart.

πŸ“Š Volume on Unfinished Bars
You can now see volume forming in real time on the current (unfinished) bar for better intrabar analysis.

🎯 Auto Breakeven
A new Auto Breakeven feature automatically moves your stop loss to break even based on your setup.

πŸ–±οΈ Horizontal Scroll Hotkey
Use Shift + Scroll to scroll the chart horizontally with ease.

πŸ”„ Reset Chart View Hotkey
Quickly reset your chart view with a dedicated hotkey Shift+R.

βž• Crosshair as Default Cursor
Crosshair is now the default cursor for all new projects.

πŸ’Ύ Auto-Save on Changing Symbol or Timeframe
Projects now automatically save when switching timeframes or symbols.

πŸ“Έ Enhanced Screenshot Handling
You can now download and copy screenshots directly from Notes and Journal.

βš™οΈ Improved Template Workflow
Working with chart, tool, and indicator templates is now smoother and more predictable.

🎨 Color Opacity Control
Added a dedicated input for adjusting color transparency across the platform.

⏱️ Seconds in Time Labels
Time labels in the Journal and Terminal now include seconds for more precise tracking.

πŸ“Š MACD Histogram Shading
The MACD histogram now includes color shading for improved visual clarity.


πŸ”§ New Indicators

πŸ“… ICT Daily Levels
Displays key daily levels based on ICT methodology.

πŸ”Ί Swings High/Low
Automatically identifies swing highs and lows for better structure analysis.


🧩 UI/UX Improvements and Fixes

πŸ–₯️ Terminal UX Improvements
Improved overall usability and interaction within the trading terminal.

πŸ“‰ Reset Chart View Behavior
Now correctly resets zoom, scale, and scrolls to the latest bar.

πŸ“° News Marker Positioning
News markers have been repositioned to avoid overlapping chart bars.

πŸ“Š Adaptive Bar Data Line
The bar info panel (Date/Time, OHLC, Volume) is now responsive and easier to read.

βž• Crosshair Switching
Fixed inability to switch to crosshair while a tool is active.

πŸ“… Calendar Restrictions & Filters
Better date selection limits and improved filter behavior.

🎨 Chart UI Polishing
Multiple visual and interaction improvements across the chart.

πŸ“ˆ Text on Lines
Improved text rendering β€” now embedded into lines.

🎨 Chart Color Settings
Fixed issues with applying colors for candles, fillers, and shadows.

πŸ”Ί Ribbon Scroll Arrows
Fixed display issues.

πŸ”— Exit Optimizer Tooltip
Added a direct link to the blog inside the Exit Optimizer tooltip.


🐞 Bug Fixes

Trading Sessions & Jump To
Fixed incorrect session handling caused by timezone issues.

Tags & Checkpoints
Resolved disappearing tags after using checkpoints.

Fibo & Gann Levels Editing
Fixed issues when editing levels containing commas.

Chart View After Reload
Fixed incorrect visible area after page refresh.

Right Offset Behavior
Eliminated last-bar shifting when switching timeframes.

USTECH100 Time Shift
Corrected data time alignment issues.

Magnet Mode Stability
Improved snapping behavior and stability.

Journal Export
Fixed incorrect Confidence values in exported data.

Price Consistency
Fixed mismatched prices across different timeframes.

Price Decimals
Fixed decimals for Open/Market price and SL/TP.

VWAP & Rolling VWAP
Fixed incorrect behavior on Heikin Ashi charts.

Heikin Ashi Sync
Resolved desynchronization issues.

Robot Reset Issue
Fixed strategy settings resetting when changing timeframe or symbol.

Watchlist Symbols
Corrected symbol display after importing indicator templates.


πŸ”Œ API Updates

Added ability to Lock / Unlock objects via API

Improved GetObjectNumberProperty and MoveObject behavior

February 24th, 2026

New Features, Indicators & Performance Improvements

This update brings new tools for trade management, new metric in analytics, additional indicators, and a range of fixes to make your experience smoother and more stable. Here’s what’s new:

πŸ”§ New Features & Improvements

πŸ” Trailing Stop on Order Open
You can now enable Trailing Stop directly in the order opening window for faster and more flexible risk management.

πŸ–₯️ One-chart Maximizing/Minimizing (using Alt+Click or Alt+Enter combination)
Added a button to expand one chart to fullscreen and quickly return to the previous layout in multicharting. Just use Alt+click or Alt+Enter on the active chart.

πŸ“Š Average Trade Metric
A new Average Trade parameter has been added to Analytics to help you evaluate your typical trade performance.

πŸ“¦ Enhanced Volume Profile Levels
The VRVP indicator and Fixed Range Volume Profile tool now support POC, VAH, and VAL levels.

🌊 Elliott Waves: Starting Point β€œ0”
The Elliott Waves drawing tool now includes a labeled starting point 0.

⭐ Favorite Timeframes per Account
Your favorite timeframes are now saved at the account level and synced across sessions.

βœ… Create Checklist from Journal
You can now create a checklist directly from the Trading Journal dropdown.

πŸ“‰ New Indicators Added

  • Bollinger Bands %B

  • Gann HiLo

  • Perfect Commodity Channel Index (PCCI)

  • Range Expansion Index (REI)


πŸ› οΈ Bug Fixes & Stability Improvements

πŸ“ˆ Profit Chart UI fixes
The Profit Chart has been visually fixed to improve clarity and make performance analysis easier.

⏱️ Timeframes in Drawing Tools
Resolved an issue where custom timeframes were added as unchecked by default.

🏷️ Order Tags UI Fixes
Fixed several visual issues related to order tags.

Persistent Settings Windows Bug
Settings windows for Notes and Indicators no longer remain open when switching projects.

πŸ”„ Bar Back Testing Logic
Fixed incorrect Bar Back behavior when data was unavailable for one of the symbols.

πŸ“‰ KAMA Indicator
Resolved display issues when scrolling the chart to the right.

πŸ” Chart Zoom & Scroll Improvements

  • The last bar no longer moves out of view when zooming out

  • Reduced chart jitter in multi-chart mode

  • Improved scroll responsiveness during zoom changes

πŸ”’ Input Fields Behavior
Fixed an issue where the last digit couldn’t be deleted and improved arrow controls in numeric inputs.

πŸ“‘ Ray Tools Visibility Fix
Improved stability for Ray-based tools (Ray, Andrew’s Pitchfork, Fibo Fan) to ensure rays display correctly.


Thanks for backtesting with us β€” more improvements are on the way!

January 29th, 2026

Exit Analyzer, Powerful Analytics & Important Fixes

We’ve rolled out a fresh update packed with new tools, deeper analytics, and a long list of fixes to make your workflow smoother and more reliable.

Here’s what’s new:

πŸ”§ New Features & Improvements

πŸ“Š Exit Analyzer in Analytics
We`ve added a tool that helps you find optimal Stop Loss, Take Profit, and trade holding time based on historical data. View key performance metrics (Net Profit, Profit Factor, Win Rate) and adjust parameters manually to test result stability or discover the best setup based on your own criteria.

πŸ“ˆ Profit Chart Widget
A brand-new analytics widget lets you visualize Realized PnL, Equity, and Max Drawdown in one place for clearer performance tracking.

🌍 Timezones with DST Support
Our timezone list now includes built-in daylight saving time adjustments, so your charts stay accurate year-round.

πŸ“ Anchored Text & Watermarks
You can now pin text directly to the chart β€” perfect for notes, labels, or watermarking your work.

🎨 Opacity Control for Colors
Fine-tune transparency anywhere colors are used for better visual clarity and customization.

⏩ Configurable Bar Forward Increment
Control how many steps each candle advances during backtesting for more precise simulation speed.

πŸ“¦ Fixed Range Volume Profile Tool
Analyze volume distribution within a selected range using this powerful new drawing tool.

🎯 Draw Tools by Exact Coordinates
Enter precise time and price values when placing drawing tools for pixel-perfect analysis.

⌨️ Order History Hotkey
Quickly toggle chart order history visibility with a new keyboard shortcut Shift+H .

πŸ“° Day of Week in News
News cards and chart popups now display the day of the week for better context.

⚠️ Go To Safety Warning
Added a confirmation warning when using Go To from the order journal to prevent accidental jumps.

πŸ“Έ Screenshots in Notes
You can now attach and store screenshots directly inside your notes.

πŸ“ Parabolic SAR Step Setting
Customize the step parameter for the Parabolic SAR indicator.

πŸš€ Auto-Open New Projects
Newly created projects now open automatically β€” no extra clicks needed.

πŸŒ€ Fibo Time Zones Selection
You can now select Fibo Time Zone tool on the chart directly by clicking on levels.

πŸ–₯️ New 4-Chart Layout
Added a layout with 4 charts (2Γ—2 grid) for multi-market or multi-timeframe analysis.


πŸ› οΈ Bug Fixes & Stability Improvements

πŸ–±οΈ Crosshair During Drag
Fixed an issue where the crosshair cursor reverted to default while dragging charts, axes, or tools.

🎯 Drawing Tools + Esc/Backspace
Resolved unintended tool repositioning when settings were open and Esc/Backspace was pressed.

☁️ Ichimoku Jump Performance
Improved performance when using Jump To on higher timeframes with Ichimoku enabled.

↩️ Undo / Redo Fixes
Addressed multiple edge cases where undo/redo behaved inconsistently.

πŸ“’ Trading Journal UI Fixes
Cleaned up numerous UI/UX issues in the trading journal.

πŸ—‚οΈ Project & Symbol Modals
Resolved freezing issues in project creation and symbol change windows.

πŸŒ™ Ask Marker in Dark Theme
Improved text visibility for the Ask price marker in dark mode.

🧹 Console Errors
Cleaned up multiple background console errors.

πŸ“Š Chart UI Polishing
Various visual and interaction improvements across the chart.

πŸ“Œ Drawing Tools on Order Lines
Fixed a bug where drawing tools wouldn’t attach to open order lines.

πŸ“‰ Regression Channel Drawing
You can now draw the Regression Channel backward (to the left).

πŸ“Š Trading Activity by Hour Crash
Fixed an app crash when opening the Month tab in the analytics widget under certain localizations.


πŸ”Œ API Updates

  • Replaced Description with Text for all drawing objects (enables anchors and text alignment)

  • Added DATE_ONLY and TIME_ONLY factor methods

  • New method: RemoveAllObjectsByPrefix

  • Added PauseTesting support for indicators

  • Fixed buffer fill interruptions when values are missing


December 22nd, 2025

This release introduces powerful new trading tools, meaningful workflow improvements, and a wide range of stability fixes β€” all aimed at making FTO more efficient, more flexible, and more enjoyable to use.
Here’s what’s new:

πŸ”§ New Features & Improvements

Trading Journal

A brand-new trading journal is now available, allowing you to track your trades, add the confidence level, notes, tags, screenshots and review your performance more effectively.

Checklists

We’ve introduced checklists to help you follow structured trading routines and avoid missing key steps.

New Indicator: Visible Range Volume Profile

This indicator displays volume distribution based on the visible chart range, giving you deeper insight into market structure.

New Indicator: Psychological Levels

Automatically plots key psychological price levels to help identify important support and resistance zones.

Candlestick Patterns (Price Action)

A new indicator group with 13 classic candlestick patterns, including Inside Bar, Hammer, Morning star, Doji and others, has been added.

RSI Average Line

The RSI indicator now includes an average line for clearer trend and momentum analysis.

Preset Risk Buttons in Order Modal

Quick-select risk buttons (0.3%, 0.5%, 0.7%, and more) are now available when opening orders.

Project Sharing with Notes Separation

Shared projects now visually distinguish between your notes and notes created by the project owner.

Improved Right Offset Behavior

Right offset handling is now smarter and more intuitive. With Auto-Follow enabled, the chart automatically locks to the configured offset during playback. With Auto-Follow disabled, the chart respects your manually set offset and continues from exactly where you left it.

Analytics Filters & Navigation

Analytics now includes additional filters for deeper insights, along with improved navigation controls.

New Analytics Chart: Performance by Session

Analyze your trading performance across different market sessions with this new chart.

New Analytics Chart: Tag Analytics

Gain insights into results based on trade tags for more structured analysis.

Customizable Active Order Buttons

You can now change the placement of active order buttons to better match your workflow (Look for the Order and Position alignment option in Chart Settings).

Save Default Chart Template

You can now save a chart template as default to start every new chart with your preferred setup.

Back Button in Analytics

A new β€œBack” button has been added to the top-left corner of the Analytics page.

Top Toolbar Redesign

The top toolbar in FTO has received a subtle visual refresh for better clarity and usability.

Screenshot Loader Indicator

When taking a screenshot, a loading indicator now clearly shows when the image is being generated.

Improved Testing Panel Positioning

The default position of the testing panel was adjusted so it’s no longer overlapped by toast notifications.

Ticks Enabled on Starter Plan

Tick data is now available for users on the Starter plan.

Order Modal UI Improvements

Updated icons and tooltips in the order modal improve clarity and ease of use.

Automatic Strategies Renamed to Robots

We’ve unified terminology across the platform β€” β€œStrategies” are now called Robots everywhere in the UI.

Chart Performance Optimizations

Significant performance improvements have been made when working with charts, especially in complex setups.


πŸ› οΈ Bug Fixes

MACD Signal Line

Fixed incorrect behavior of the MACD signal line.

Pivot Points for NY Bars

Resolved issues with Pivot Points calculation for New York session bars.

Pending Order β€œAt Price” Field

Fixed incorrect price display when editing pending orders via right-click on the chart.

Risk/Reward Tool Templates

The RR tool no longer disappears when applying older templates.

Graph Tool Line Extensions

Line extensions are now correctly saved in templates, even when enabled via hotkeys.

Invalid Orders After Project Load

Fixed issues with invalid SL/TP and pending orders after loading a project.

Analytics Trading Calendar

Fixed an issue where the activity calendar was empty when the interface language was set to Spanish.

Chart Tool Performance

Optimized performance when working with large numbers of graphical tools.

Order Editing Modal

Fixed an issue allowing symbol changes in the order-editing dropdown.

Symbol Conversion Search and Calculations

Fixed issues with symbol conversion search and corrected calculations for cross pairs without USD.

Notes Dark Theme

Corrected text color issues in Notes when using the dark theme.

November 25th, 2025

In this quick update we’ve redesigned the dashboard to make it cleaner, more structured, and easier to navigate. 🎨

The new layout improves clarity and provides a smoother experience when managing your projects. πŸš€

November 17th, 2025

Hi everyone!

We’ve added new improvements, polished key workflows, and resolved important bugs to make your experience smoother and more efficient.
Here’s what’s improved:


πŸ”§ New Features & Improvements

Smarter Visibility Control for Chart Objects

You can now manage object visibility across timeframes using a new dedicated section in the graphical object right-click menu.

Improved Price Scale Overlap Handling

When two lines overlap on the price scale, values now display correctly.

Order-History Safety Warning

An alert notifies you when using Go To History Order may cause loss of historical orders and backtesing results.

New Pivot Points Type: Woodie

We've added the Woodie version of Pivot Points for more flexible analysis.

Clearer Symbol Availability UI

Symbol-selection modals now show data availability more clearly, helping you avoid empty ranges of symbol data in project.

Move Notes on the Chart

You can now drag and reposition notes just like any graphical tool.

Add Symbols Faster in Watch List

A new Add Symbol button is now available directly in the Watch List.

Adaptive Line Chart Scaling

Line Chart thickness automatically adapts to the resolution of your monitor.

Improved Object Dragging

Shapes (Rectangular, Triangle, Ellipse) can now be moved by grabbing any filled area β€” much more intuitive.

Cleaner, Consistent Chart Mode Hotkeys

Hotkeys in Chart Mode have been reorganized and corrected for consistency.

Mobile-Friendly Experience

The chart context menu is now disabled on mobile for smoother interaction.


πŸ› οΈ Bug Fixes

Ananlytics Calendar Month Filter Fixed

Filtering by month in analytics now correctly shows only that month’s data.

Start Date Validation Fixed

Unavailable dates can no longer be selected when creating new projects.

Fixed Y-Axis Price Rendering

Long decimal or large value numbers render cleanly without distortion.

Calendar Opens on Active Test Date

The calendar now defaults to the date currently used in testing.

Critical Fix for Starter Plan Projects

Projects now load correctly even when a symbol reaches the end of its data.

Correct Rendering of M15 Bars Timeframe

A critical issue with M15 bar generation has been resolved.

Charts Open with Synchronized Settings

New charts no longer revert to default parameters unexpectedly.

Trend Lines on Lower Timeframes

Support lines (and similar tools) now display correctly on low timeframes.

Closed-Order Line Visibility Fixed

Lines no longer disappear when entry/exit points are outside chart bounds.

Improved Go To Logic for Indicator Lines

The Go To feature now correctly targets indicator lines via selected tools.

Crash Fix When Reverting Saves

Reverting a save no longer crashes the project when the trading terminal is open.

Strategy Persistence Fixed

Projects now reload properly even after refreshing the page during strategy execution.

Remove Indicators Works Instantly

Indicators now disappear immediately after using Remove Indicators button.

Google Login Fixed in Safari

Authentication via Google now works correctly on Safari browsers.

Correct Project Duplication

Projects duplicated from the Saves tab now load as valid copies.

Blind Testing Stability Improvements

Multiple fixes applied for better reliability in Blind Testing mode.


🎨 UI Enhancements

Cleaner Indicator Settings Layout

Design-appropriate separators added to the indicator settings window.

Inputs & Style Tabs

Indicator settings are now split between Inputs and Style tabs.

Smarter Symbols Input

Symbol selection in filters now works like a tag input β€” more intuitive and faster.

Updated Layout Icons

Icons for 7-, 8-, 9- and 10-chart layouts have been refreshed.