January 29th, 2026
27th FTO Release (29 Jan 2026)
Exit Analyzer, Powerful Analytics & Important Fixes
We’ve rolled out a fresh update packed with new tools, deeper analytics, and a long list of fixes to make your workflow smoother and more reliable.
Here’s what’s new:
🔧 New Features & Improvements
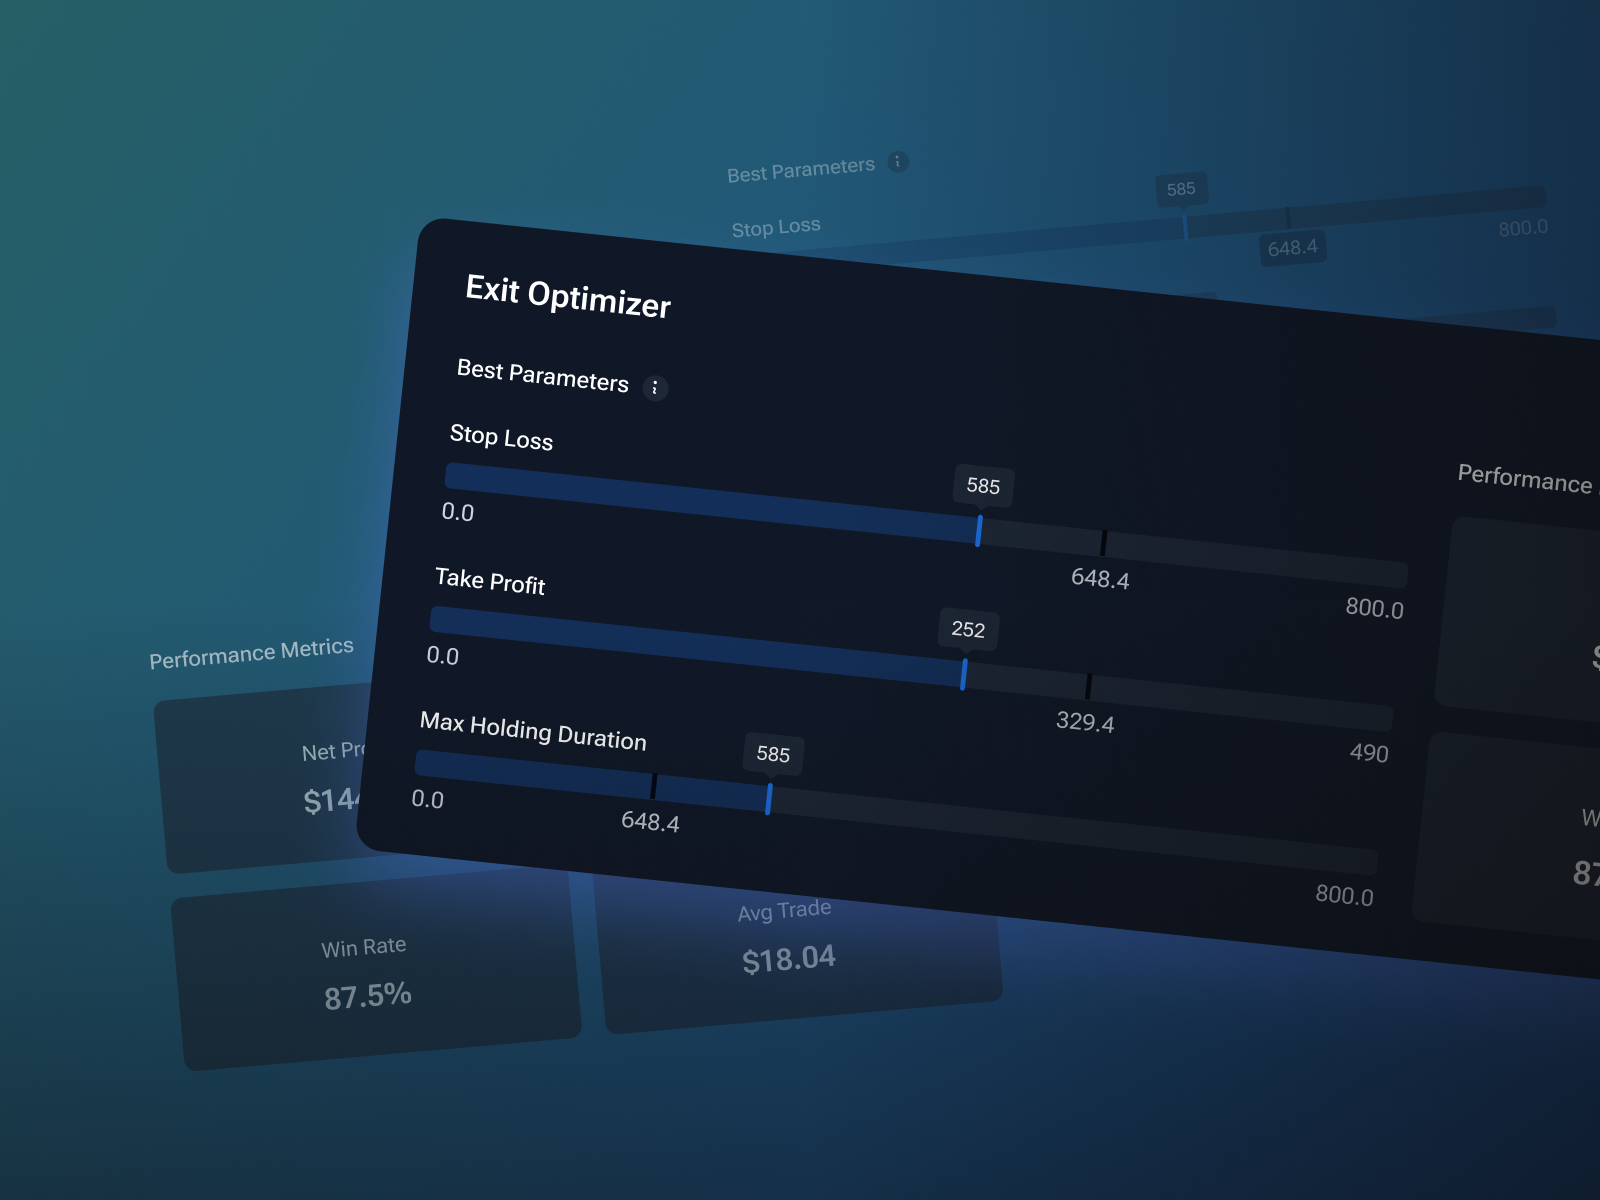
📊 Exit Analyzer in Analytics
We`ve added a tool that helps you find optimal Stop Loss, Take Profit, and trade holding time based on historical data. View key performance metrics (Net Profit, Profit Factor, Win Rate) and adjust parameters manually to test result stability or discover the best setup based on your own criteria.
📈 Profit Chart Widget
A brand-new analytics widget lets you visualize Realized PnL, Equity, and Max Drawdown in one place for clearer performance tracking.
🌍 Timezones with DST Support
Our timezone list now includes built-in daylight saving time adjustments, so your charts stay accurate year-round.
📝 Anchored Text & Watermarks
You can now pin text directly to the chart — perfect for notes, labels, or watermarking your work.
🎨 Opacity Control for Colors
Fine-tune transparency anywhere colors are used for better visual clarity and customization.
⏩ Configurable Bar Forward Increment
Control how many steps each candle advances during backtesting for more precise simulation speed.
📦 Fixed Range Volume Profile Tool
Analyze volume distribution within a selected range using this powerful new drawing tool.
🎯 Draw Tools by Exact Coordinates
Enter precise time and price values when placing drawing tools for pixel-perfect analysis.
⌨️ Order History Hotkey
Quickly toggle chart order history visibility with a new keyboard shortcut Shift+H .
📰 Day of Week in News
News cards and chart popups now display the day of the week for better context.
⚠️ Go To Safety Warning
Added a confirmation warning when using Go To from the order journal to prevent accidental jumps.
📸 Screenshots in Notes
You can now attach and store screenshots directly inside your notes.
📐 Parabolic SAR Step Setting
Customize the step parameter for the Parabolic SAR indicator.
🚀 Auto-Open New Projects
Newly created projects now open automatically — no extra clicks needed.
🌀 Fibo Time Zones Selection
You can now select Fibo Time Zone tool on the chart directly by clicking on levels.
🖥️ New 4-Chart Layout
Added a layout with 4 charts (2×2 grid) for multi-market or multi-timeframe analysis.
🛠️ Bug Fixes & Stability Improvements
🖱️ Crosshair During Drag
Fixed an issue where the crosshair cursor reverted to default while dragging charts, axes, or tools.
🎯 Drawing Tools + Esc/Backspace
Resolved unintended tool repositioning when settings were open and Esc/Backspace was pressed.
☁️ Ichimoku Jump Performance
Improved performance when using Jump To on higher timeframes with Ichimoku enabled.
↩️ Undo / Redo Fixes
Addressed multiple edge cases where undo/redo behaved inconsistently.
📒 Trading Journal UI Fixes
Cleaned up numerous UI/UX issues in the trading journal.
🗂️ Project & Symbol Modals
Resolved freezing issues in project creation and symbol change windows.
🌙 Ask Marker in Dark Theme
Improved text visibility for the Ask price marker in dark mode.
🧹 Console Errors
Cleaned up multiple background console errors.
📊 Chart UI Polishing
Various visual and interaction improvements across the chart.
📌 Drawing Tools on Order Lines
Fixed a bug where drawing tools wouldn’t attach to open order lines.
📉 Regression Channel Drawing
You can now draw the Regression Channel backward (to the left).
📊 Trading Activity by Hour Crash
Fixed an app crash when opening the Month tab in the analytics widget under certain localizations.
🔌 API Updates
Replaced Description with Text for all drawing objects (enables anchors and text alignment)
Added DATE_ONLY and TIME_ONLY factor methods
New method: RemoveAllObjectsByPrefix
Added PauseTesting support for indicators
Fixed buffer fill interruptions when values are missing