Problem with the charts
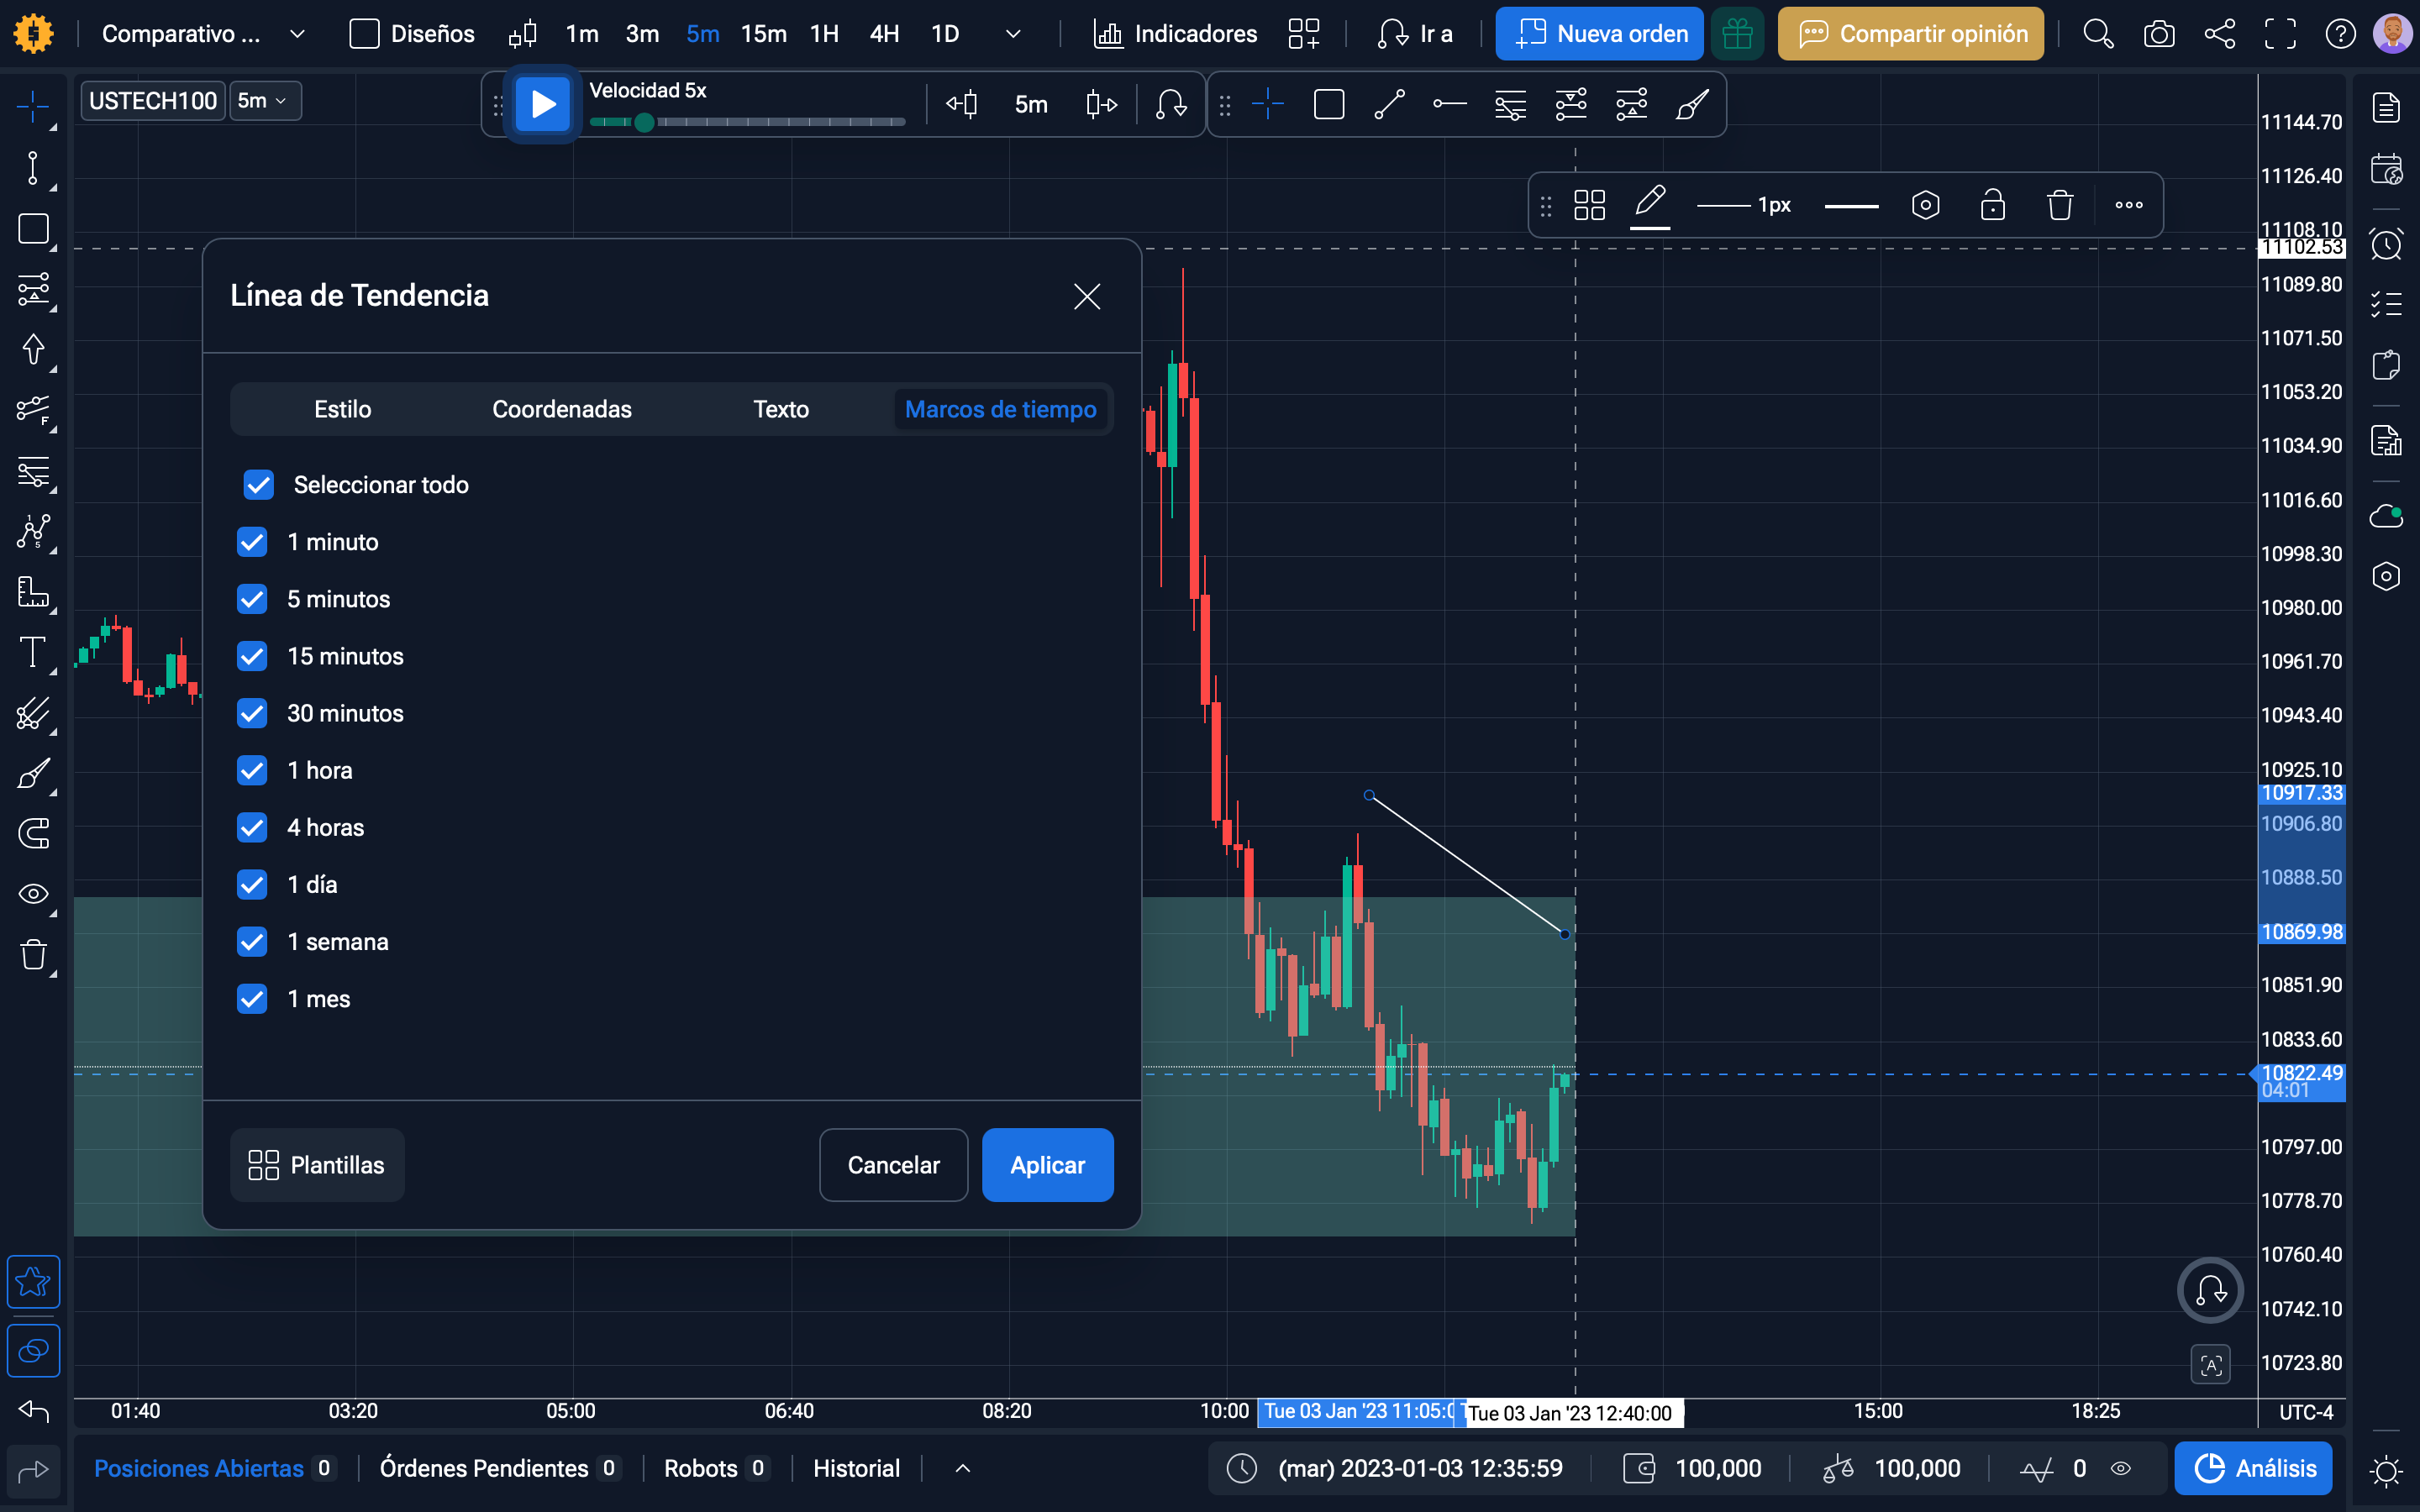
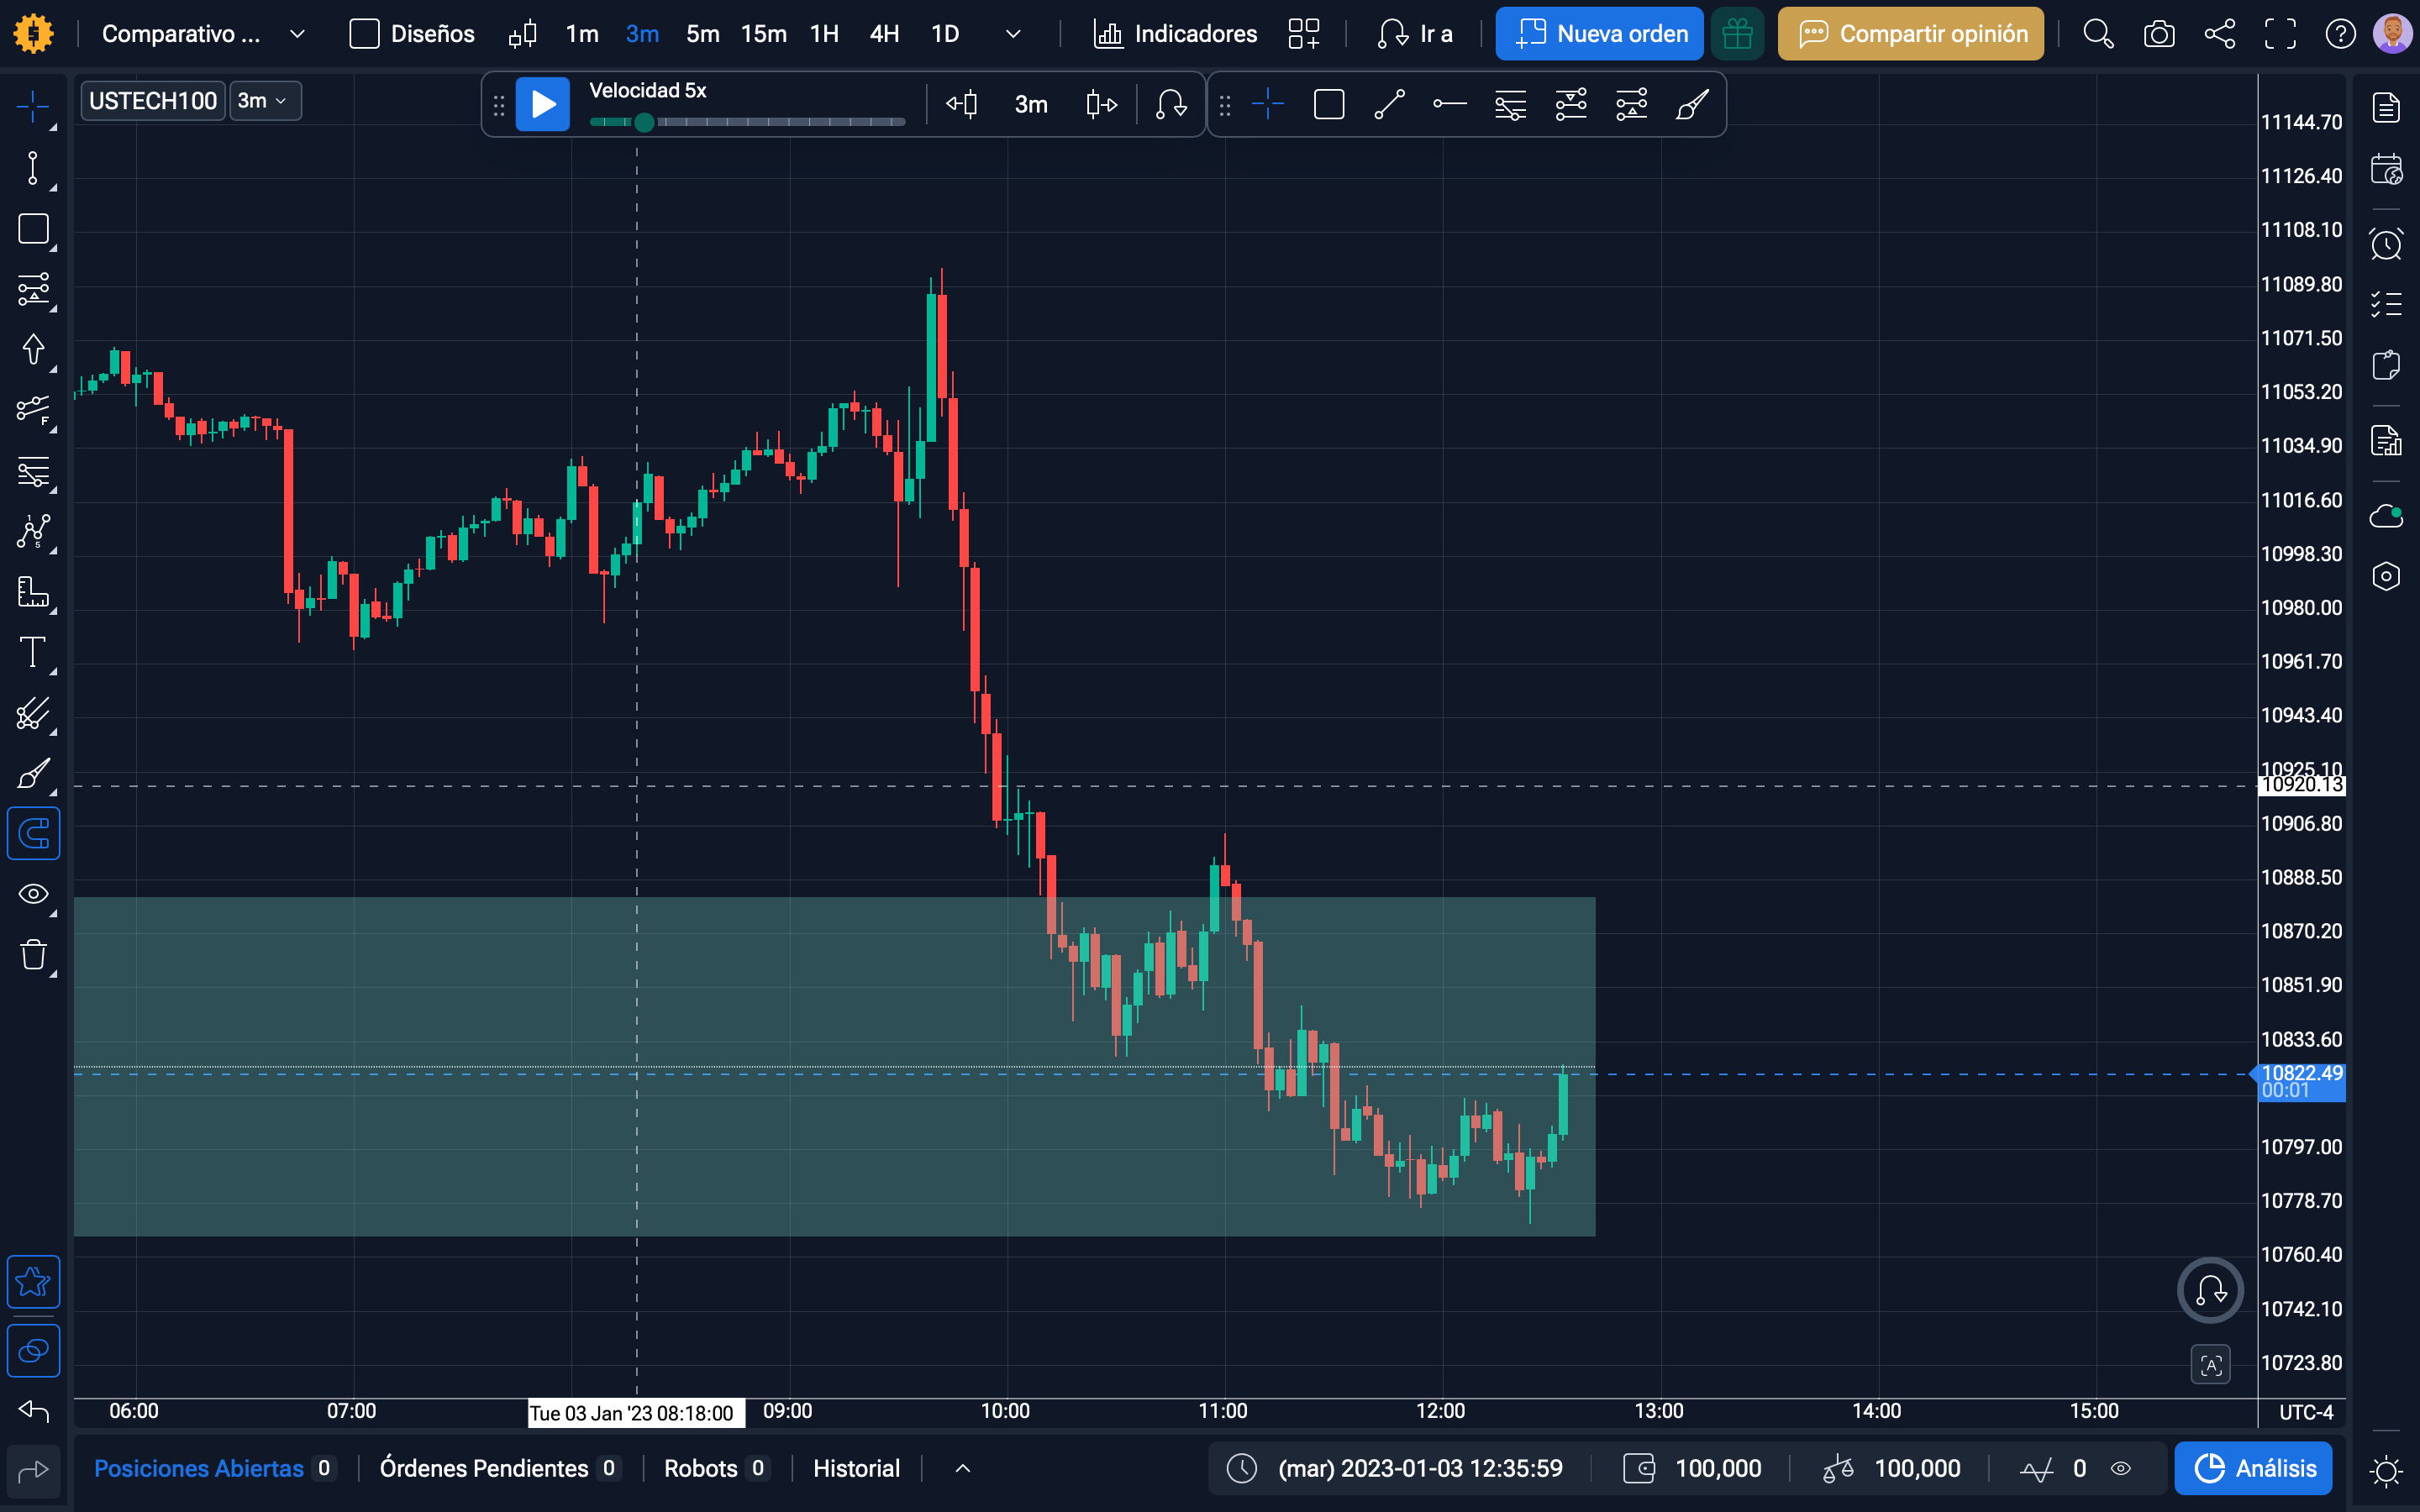
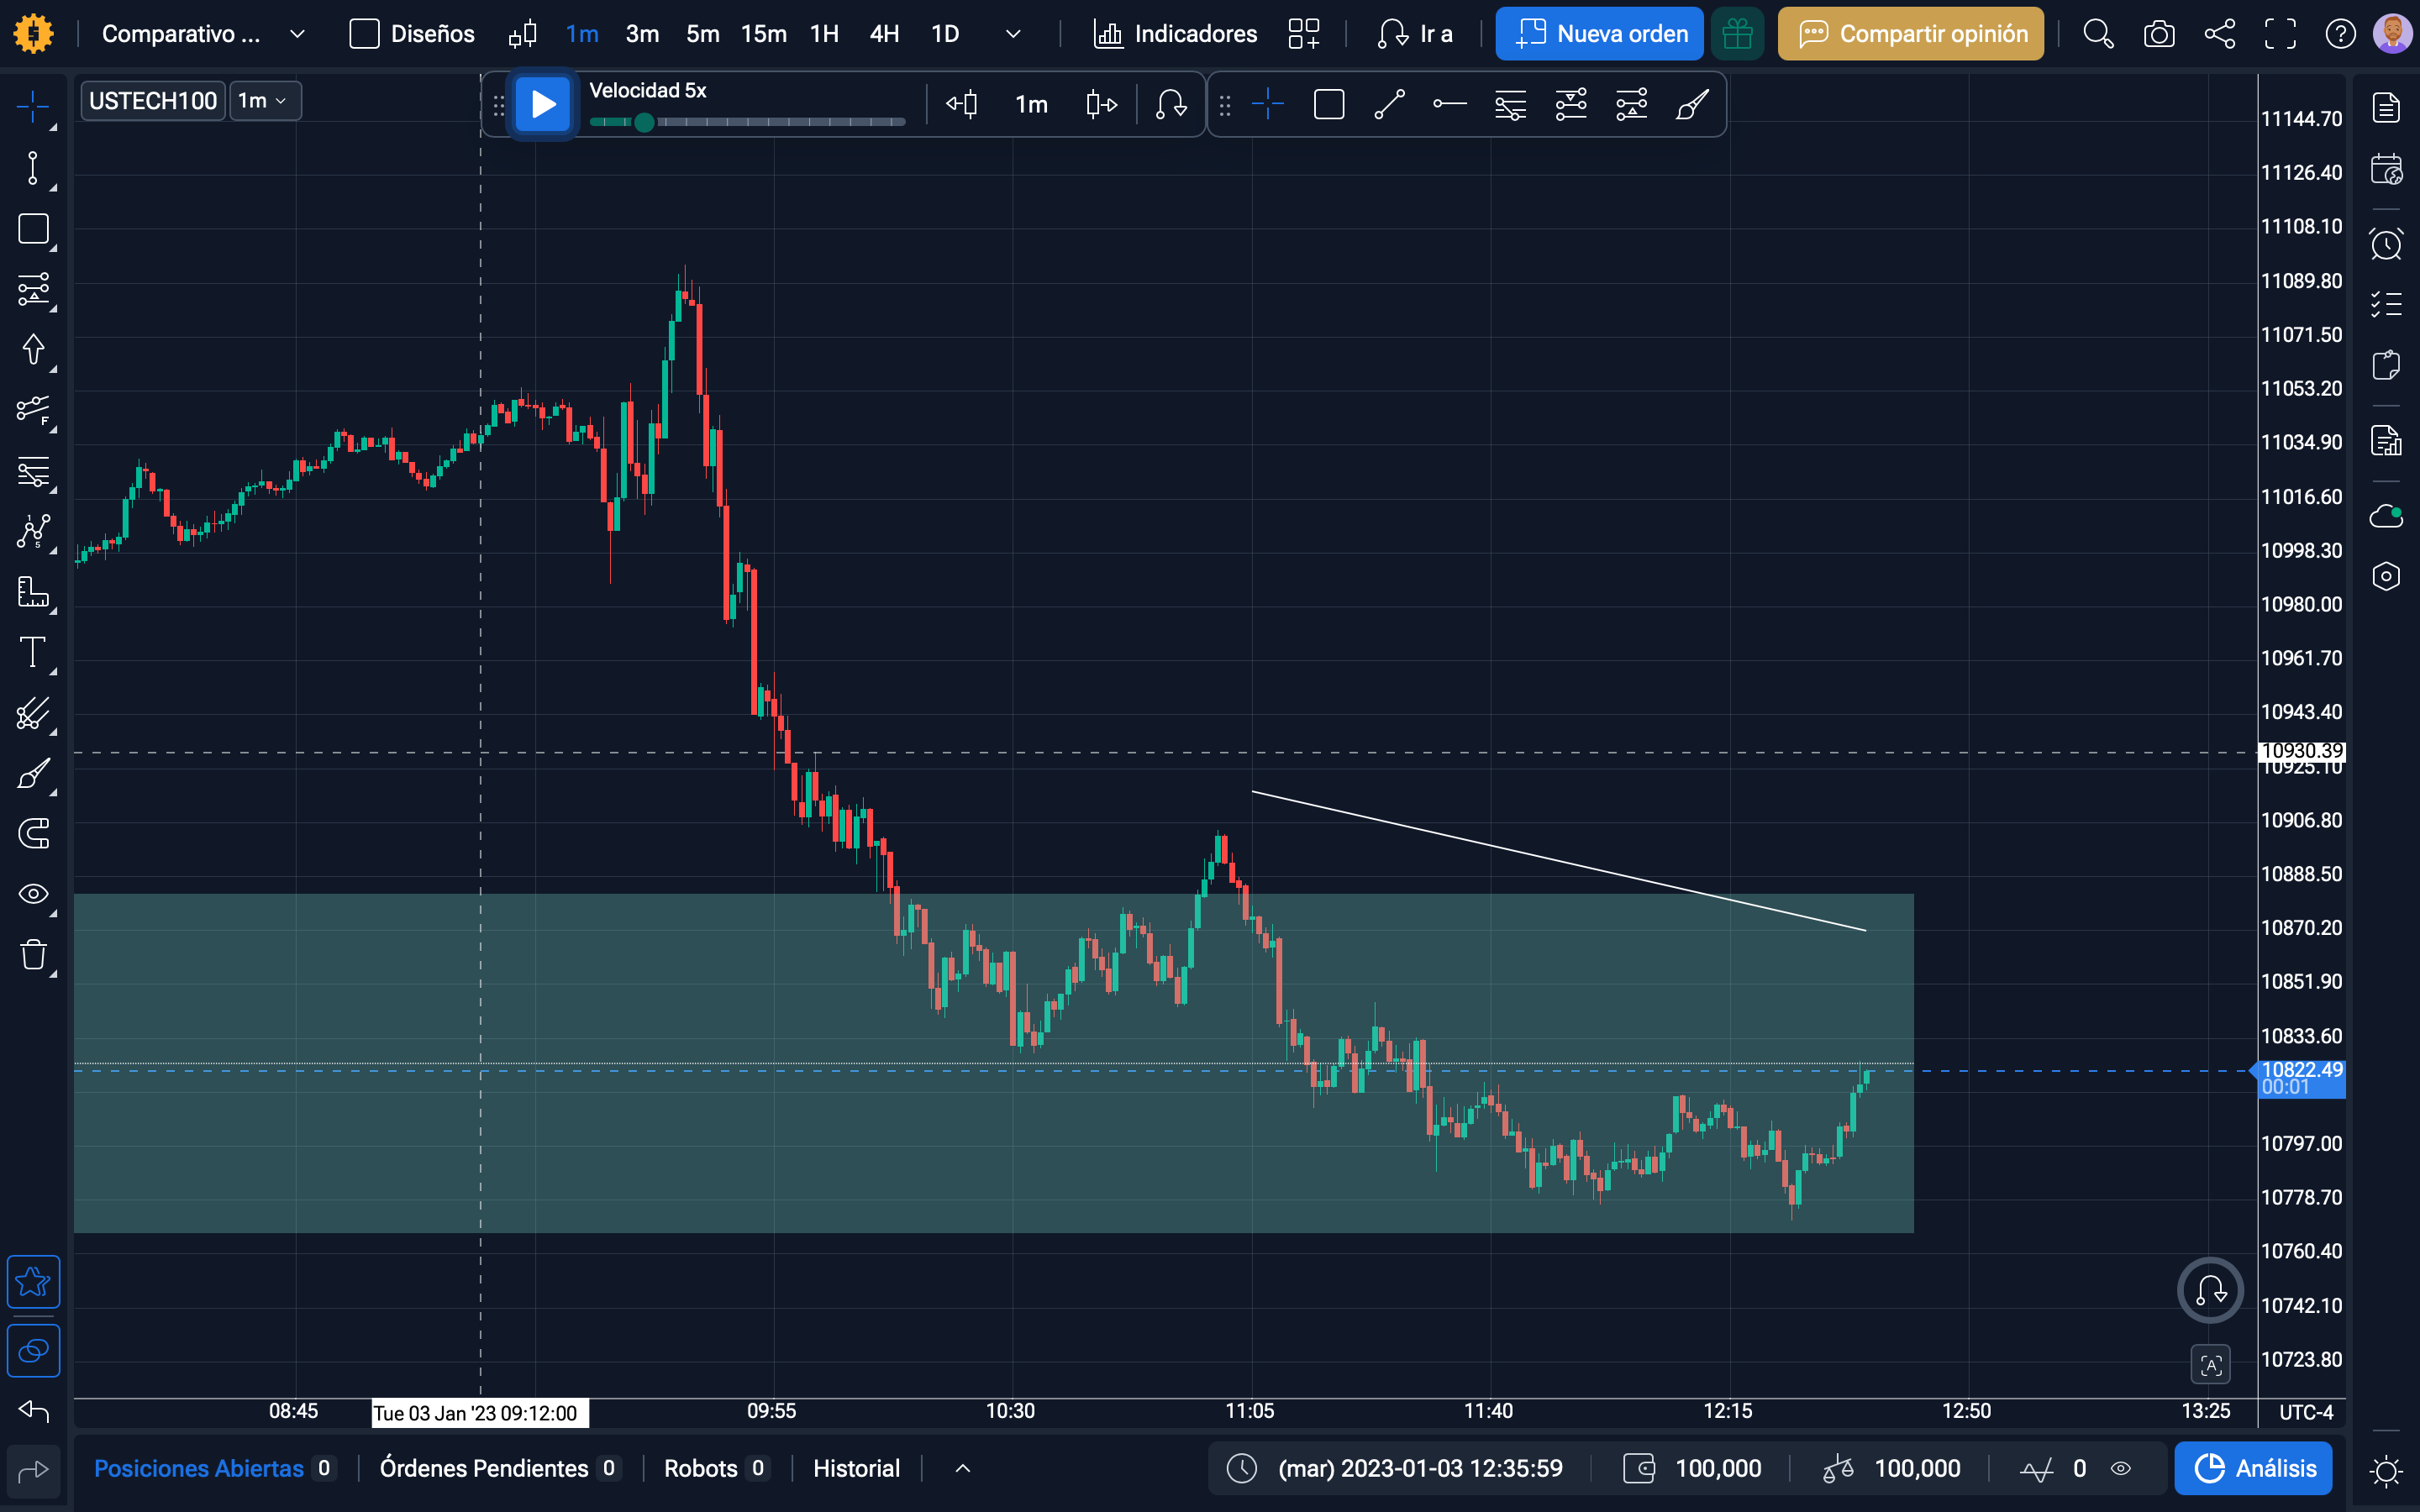
Hi! I'm having a problem with the charts. When I draw a trend line, even though I select to display it on all timeframes, I can't see it on the 3-minute timeframe. I can see it on the M5 and M1 timeframes, though.
- How does this impact your experience?
Comments4
Daryna Vasylieva
Apr 22
Hi @Emanuel Gaia !
Thank you for reaching out.
The behavior you’re experiencing is related to the 3-minute chart being a custom timeframe.
At the moment, the “display on all timeframes” option applies only to standard timeframes, which is why the trend line is visible on M1 and M5, but not on M3.
We understand how this can be inconvenient.
Our team is currently working on improvements to custom timeframes, including better support for such features. These updates are planned for release within the next 2–3 months.
We appreciate your patience and understanding.
Emanuel Gaia
Apr 22
Thank you very much for your response! I will be waiting for these updates as they will greatly help me improve my analysis.
Diana Zhoshko
Apr 23
Hi @Emanuel Gaia,
You’re very welcome! We truly appreciate your patience.
Diana Zhoshko
Apr 23
Hi, Emanuel
We just found out the workaround that should help.
If the custom timeframes are newly added, the graph tool will also be placed on those custom timeframes. But if the custom timeframes were added a while ago, you can simply add the custom timeframe again. Then, any graph tool that was set to appear on all timeframes will also show up on the newly added custom timeframe.