please Add "Reverse" Option and Improve Fibonacci Tool Display for Better Usability
I would like to kindly provide some feedback regarding the Fibonacci tool on the FTO backtesting platform.
Currently, the Fibonacci tool does not offer a "reverse" option. When I click a candle's low point first and then the high point, the Fibonacci 0% is placed at the high and 100% at the low. This is different from the logic in TradingView, where this behavior only occurs if the "reverse" option is explicitly selected.
I sincerely hope the FTO platform can align with TradingView’s logic by providing a "reverse" toggle, allowing users to control this behavior more intuitively.
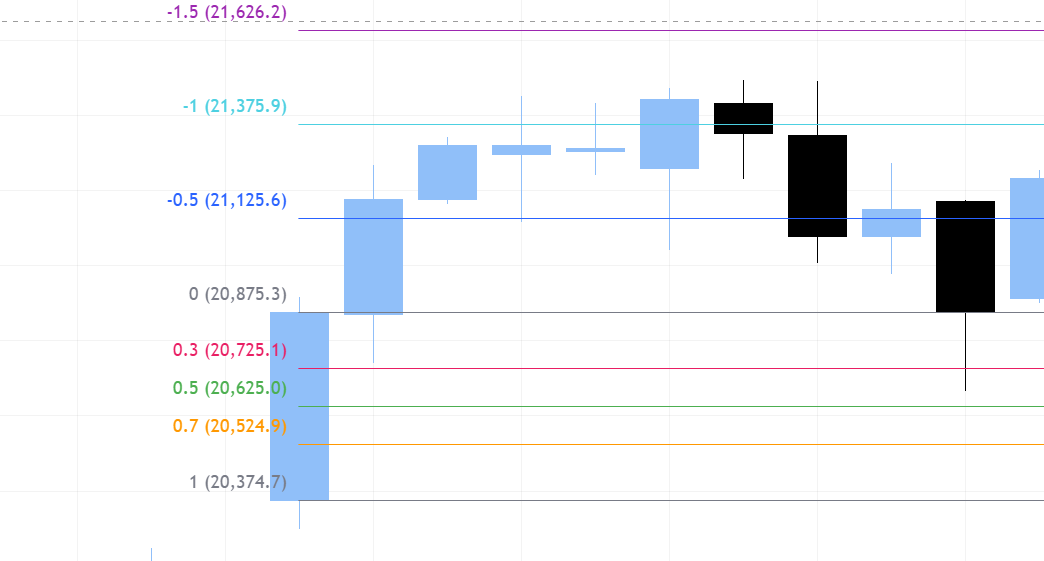
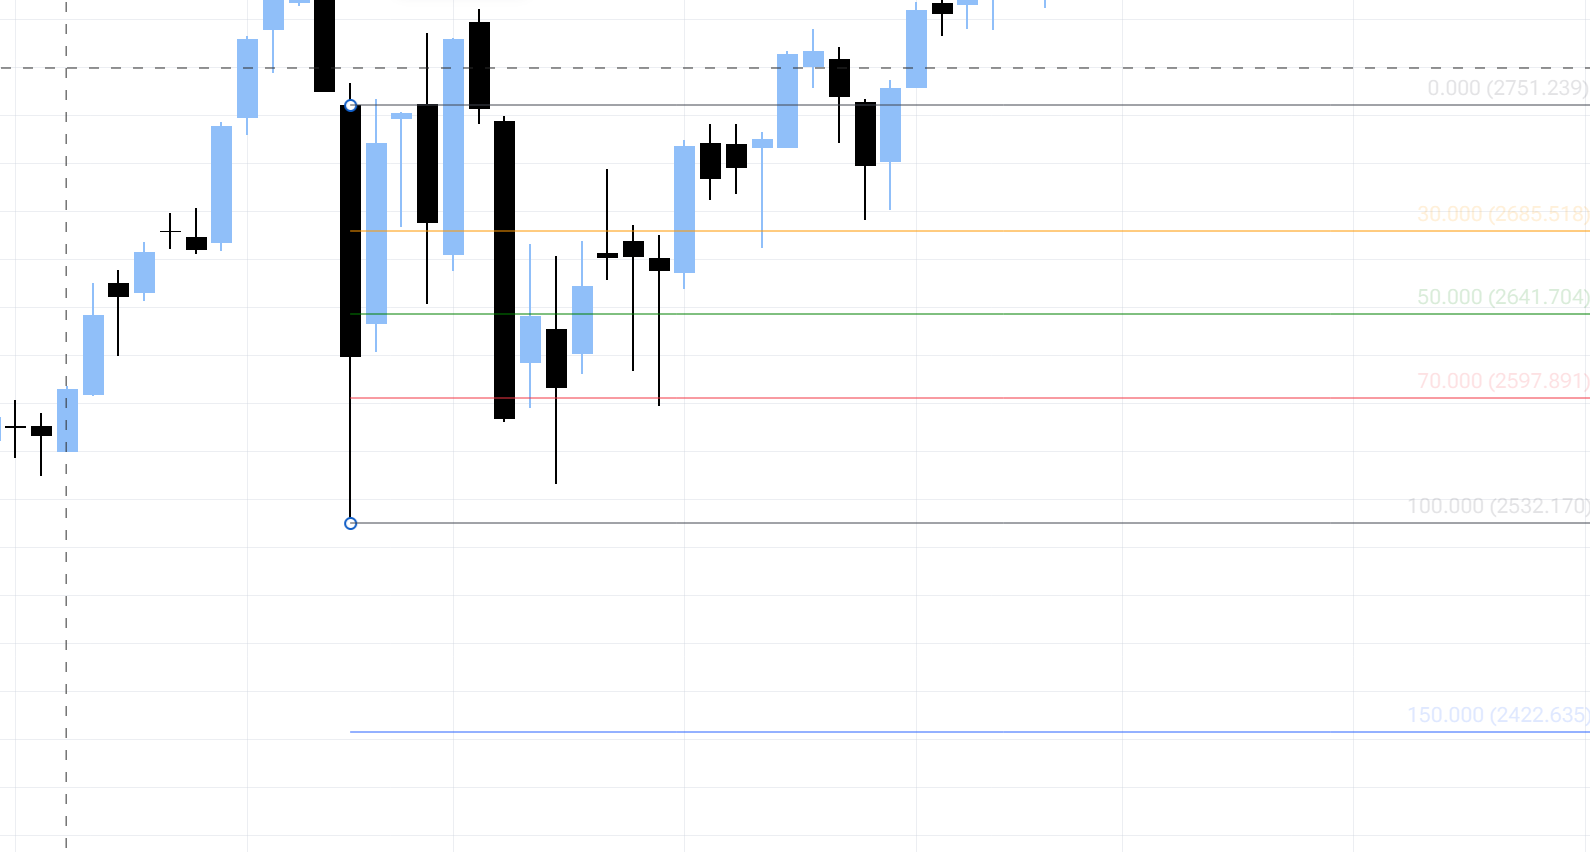
Additionally, there are noticeable differences between the way Fibonacci levels and price labels are displayed on FTO compared to TradingView. In my opinion, TradingView's design is more clear and visually intuitive.
I've attached a comparison image of the Fibonacci tools from both platforms. I hope the team can take a look and consider which one appears more clean and user-friendly.
Thank you very much for your continued efforts and for considering these suggestions!
Comments1
Serhii S.
Jul 3, 2025
Hi @User , thanks for the detailed feedback and recommendations!
For now, you can achieve the reverse behavior by placing the first point at the highest price of the candle and the second point at the lowest price. This will set the 0 level at the lowest price and 100 at the highest.
We appreciate the comparison image and your suggestions for improving the visual display. We'll definitely take this into consideration for future updates to our drawing tools.