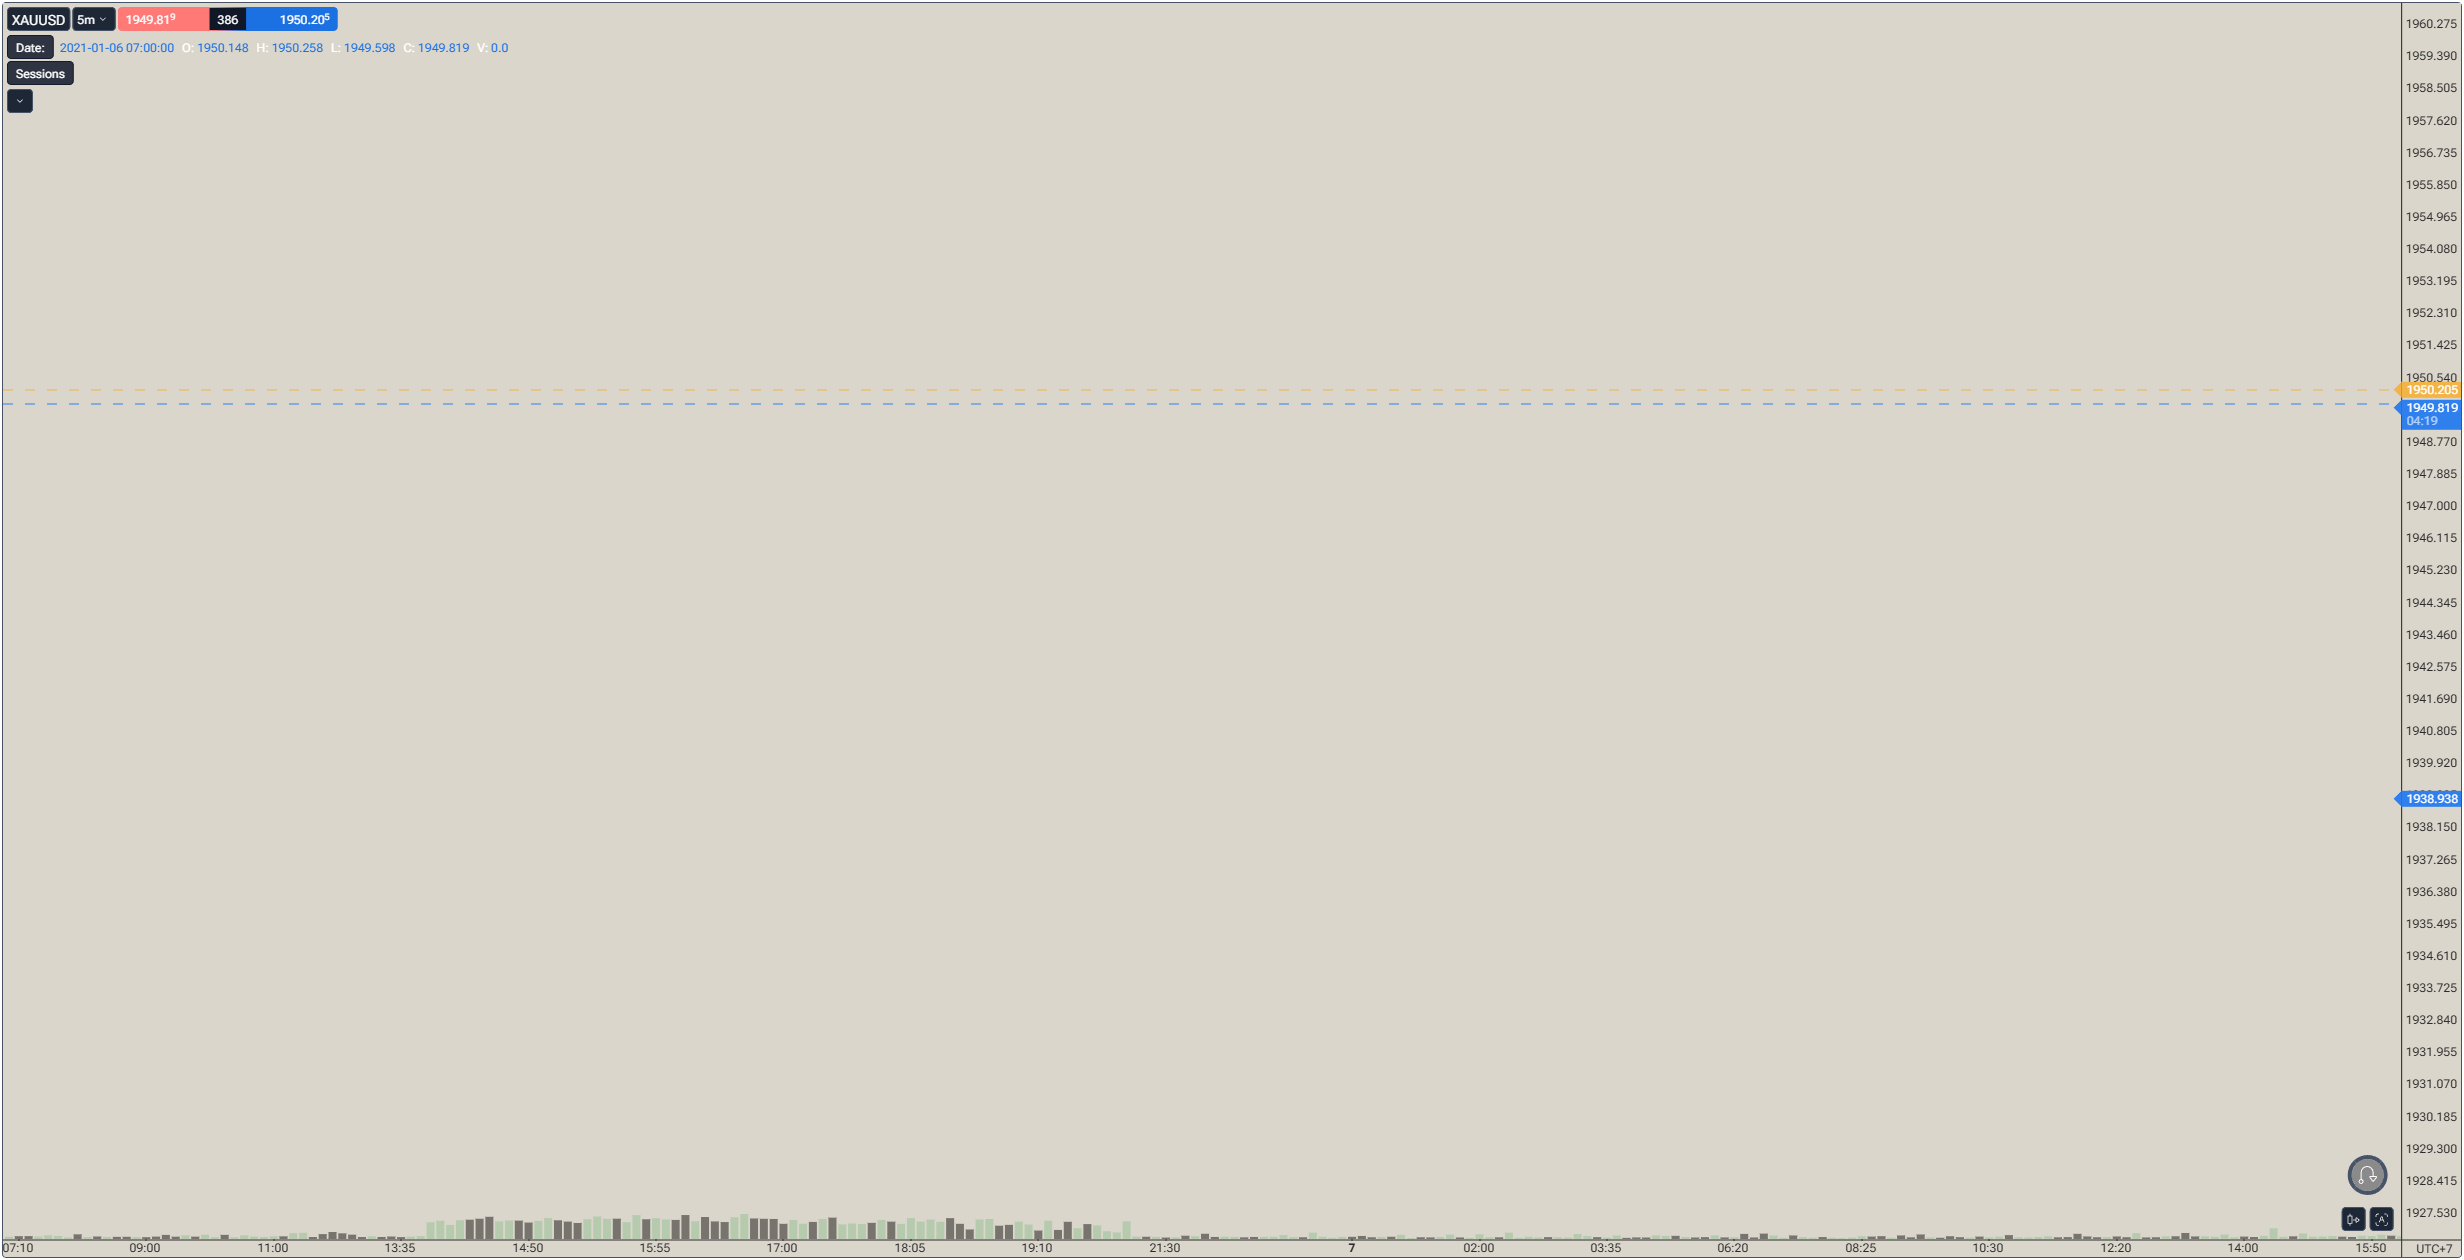
I can't see the chart.
When I return to my project to continue backtesting, however, when I change the timeframe, the chart disappears and sometimes is not visible from the moment I open it.
I don't know if it's because I have a lot of graphic objects drawing that's causing the server issues, but it shouldn't be happening.
- How does this impact your experience?
Comments2
Diana Zhoshko
Dec 8, 2025
Our developers recommend using the button at the bottom of your chart, “Reset chart Scale to the Default”:
Diana Zhoshko
Dec 8, 2025
Hi @User,
Thank you for the link.
We've forwarded your issue to our development team for review.
Once we receive an update or solution, we'll be sure to follow up with you promptly.