When using templates in the graphics tool, only some of the settings are applied to time-frame charts other than the one being edited.
When you create a graphic and apply a template while a single symbol is displayed across multiple charts with different time frames, the changes to the settings will only be partially reflected on the charts with time frames other than the one you are currently working on.
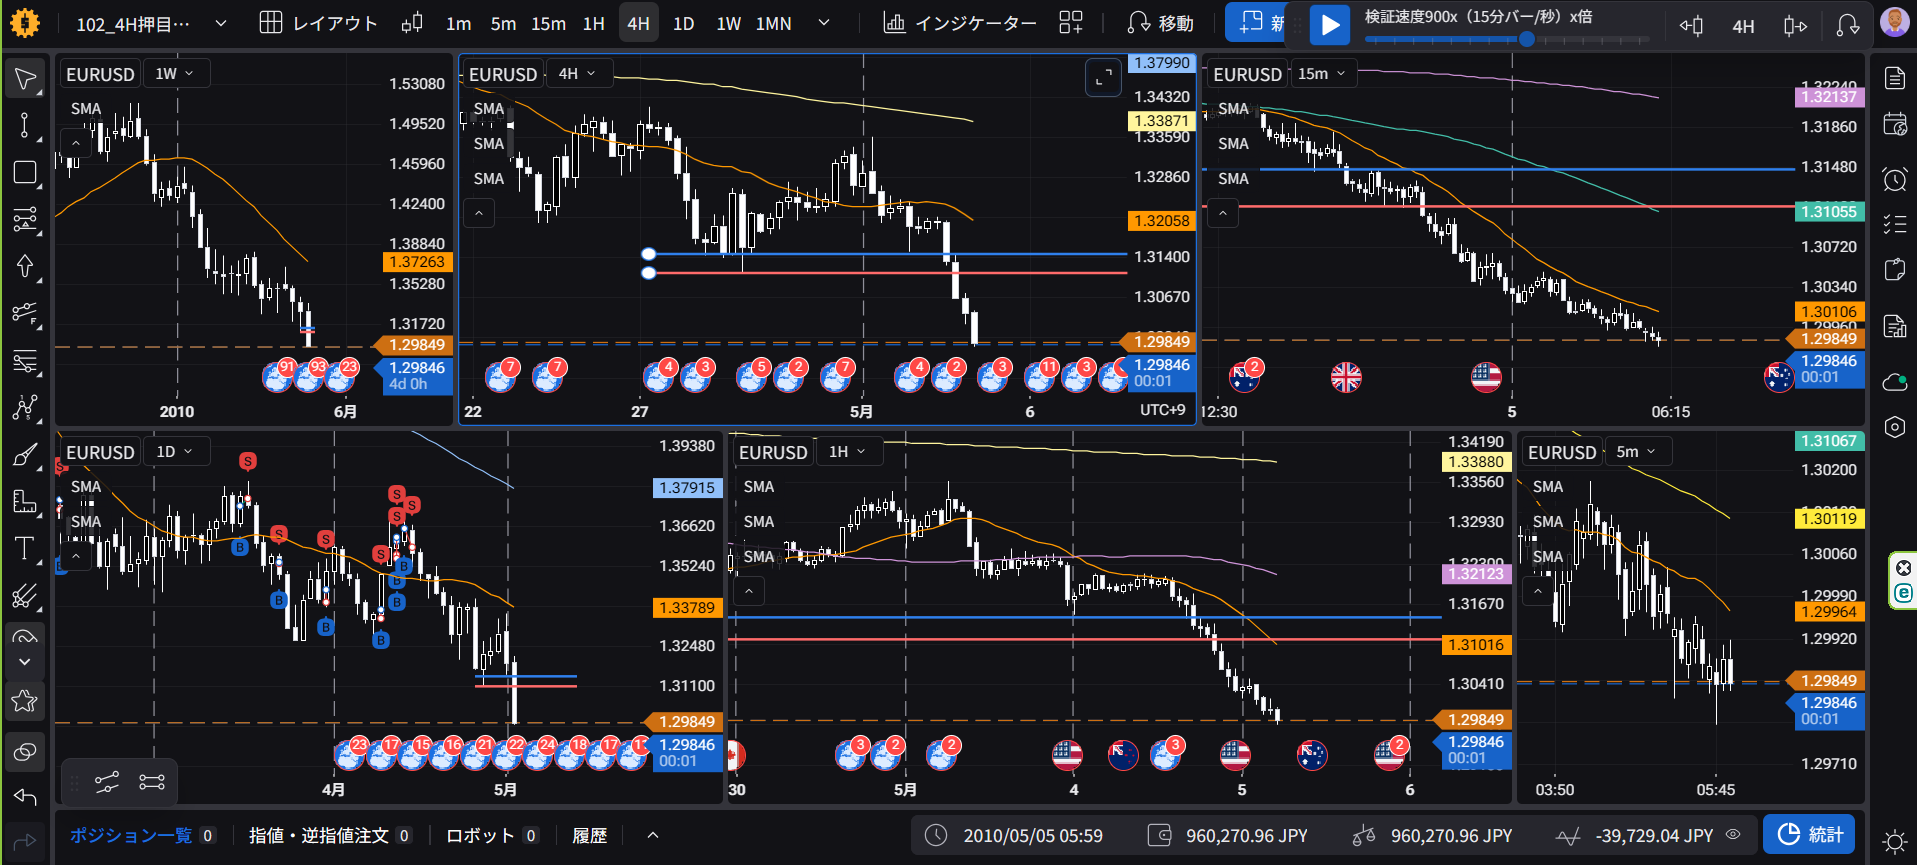
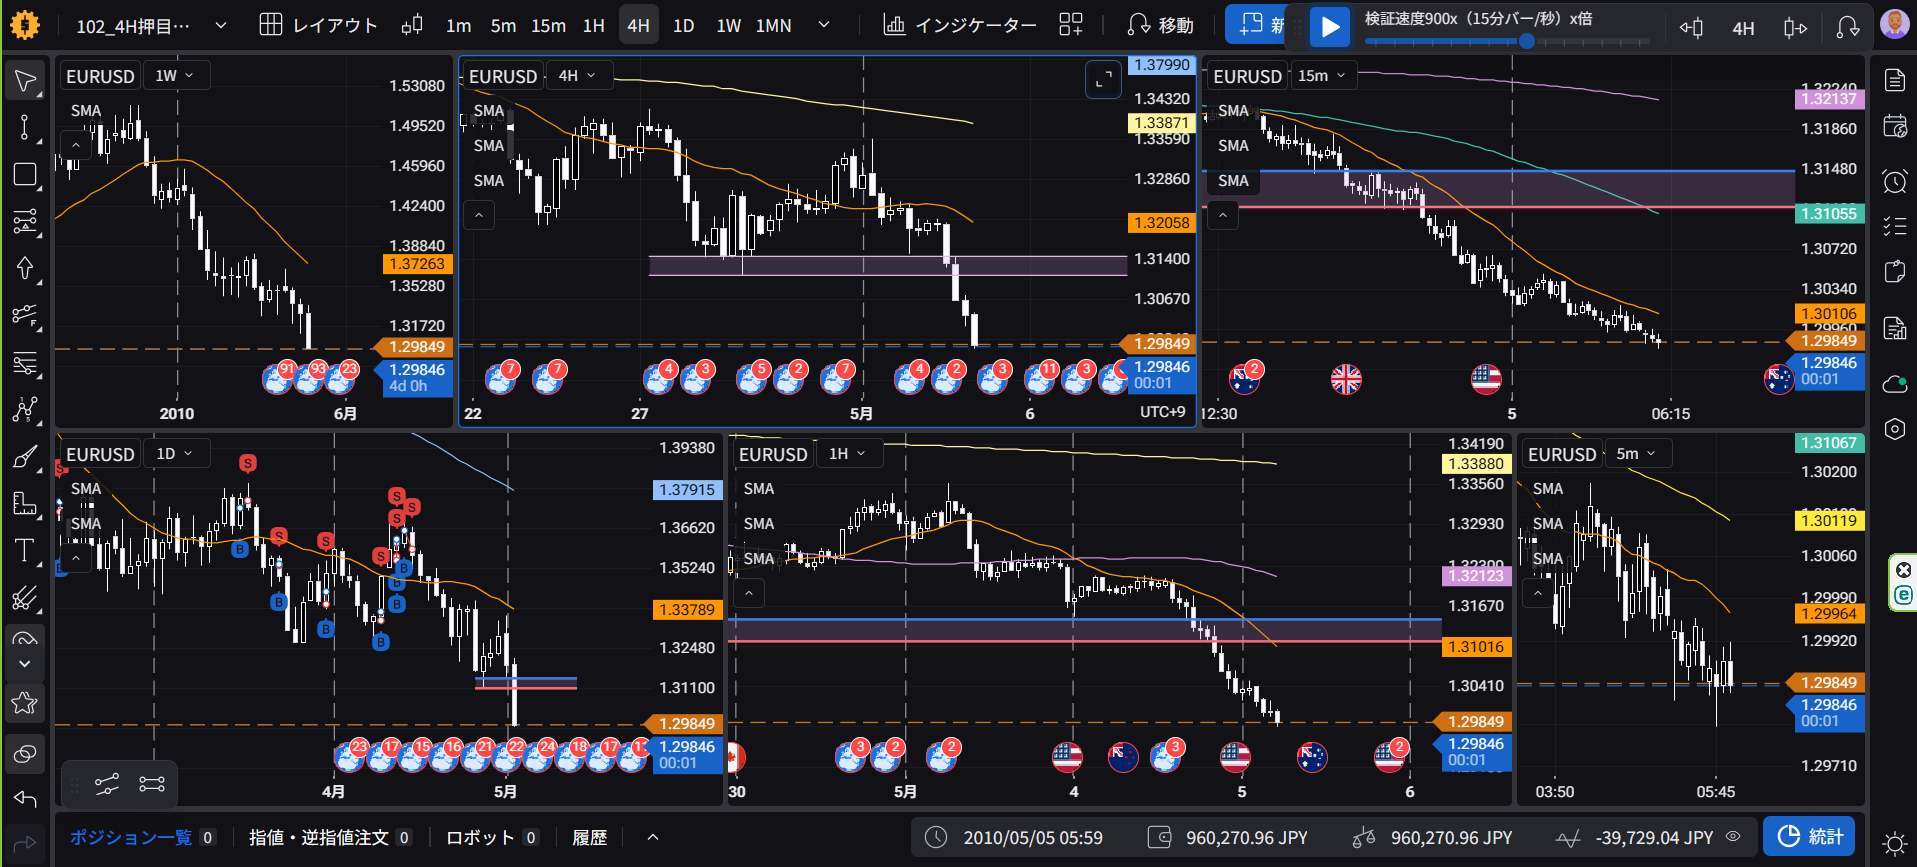
For example, if you draw an open range and apply a template, the result will look like this. The operation is being performed on a chart with a 4-hour time frame.
The background (fill) changes are reflected, but the line changes are not.
------------ Before Applying the Template ------------
------------ After Applying Template ------------
Please fix this.
- How does this impact your experience?
Comments1
Diana Zhoshko
Oct 14
こんにちは @K Y
スクリーンショットをお送りいただき、ありがとうございます。
ご報告いただいた件について、開発チームに確認を依頼しました。
進捗状況や解決策が分かり次第、速やかにご連絡いたします。
____
Hi,
Thanks for the screenshots.
I've forwarded your issue to our development team for review.
Once I receive an update or solution, I'll be sure to follow up with you promptly.