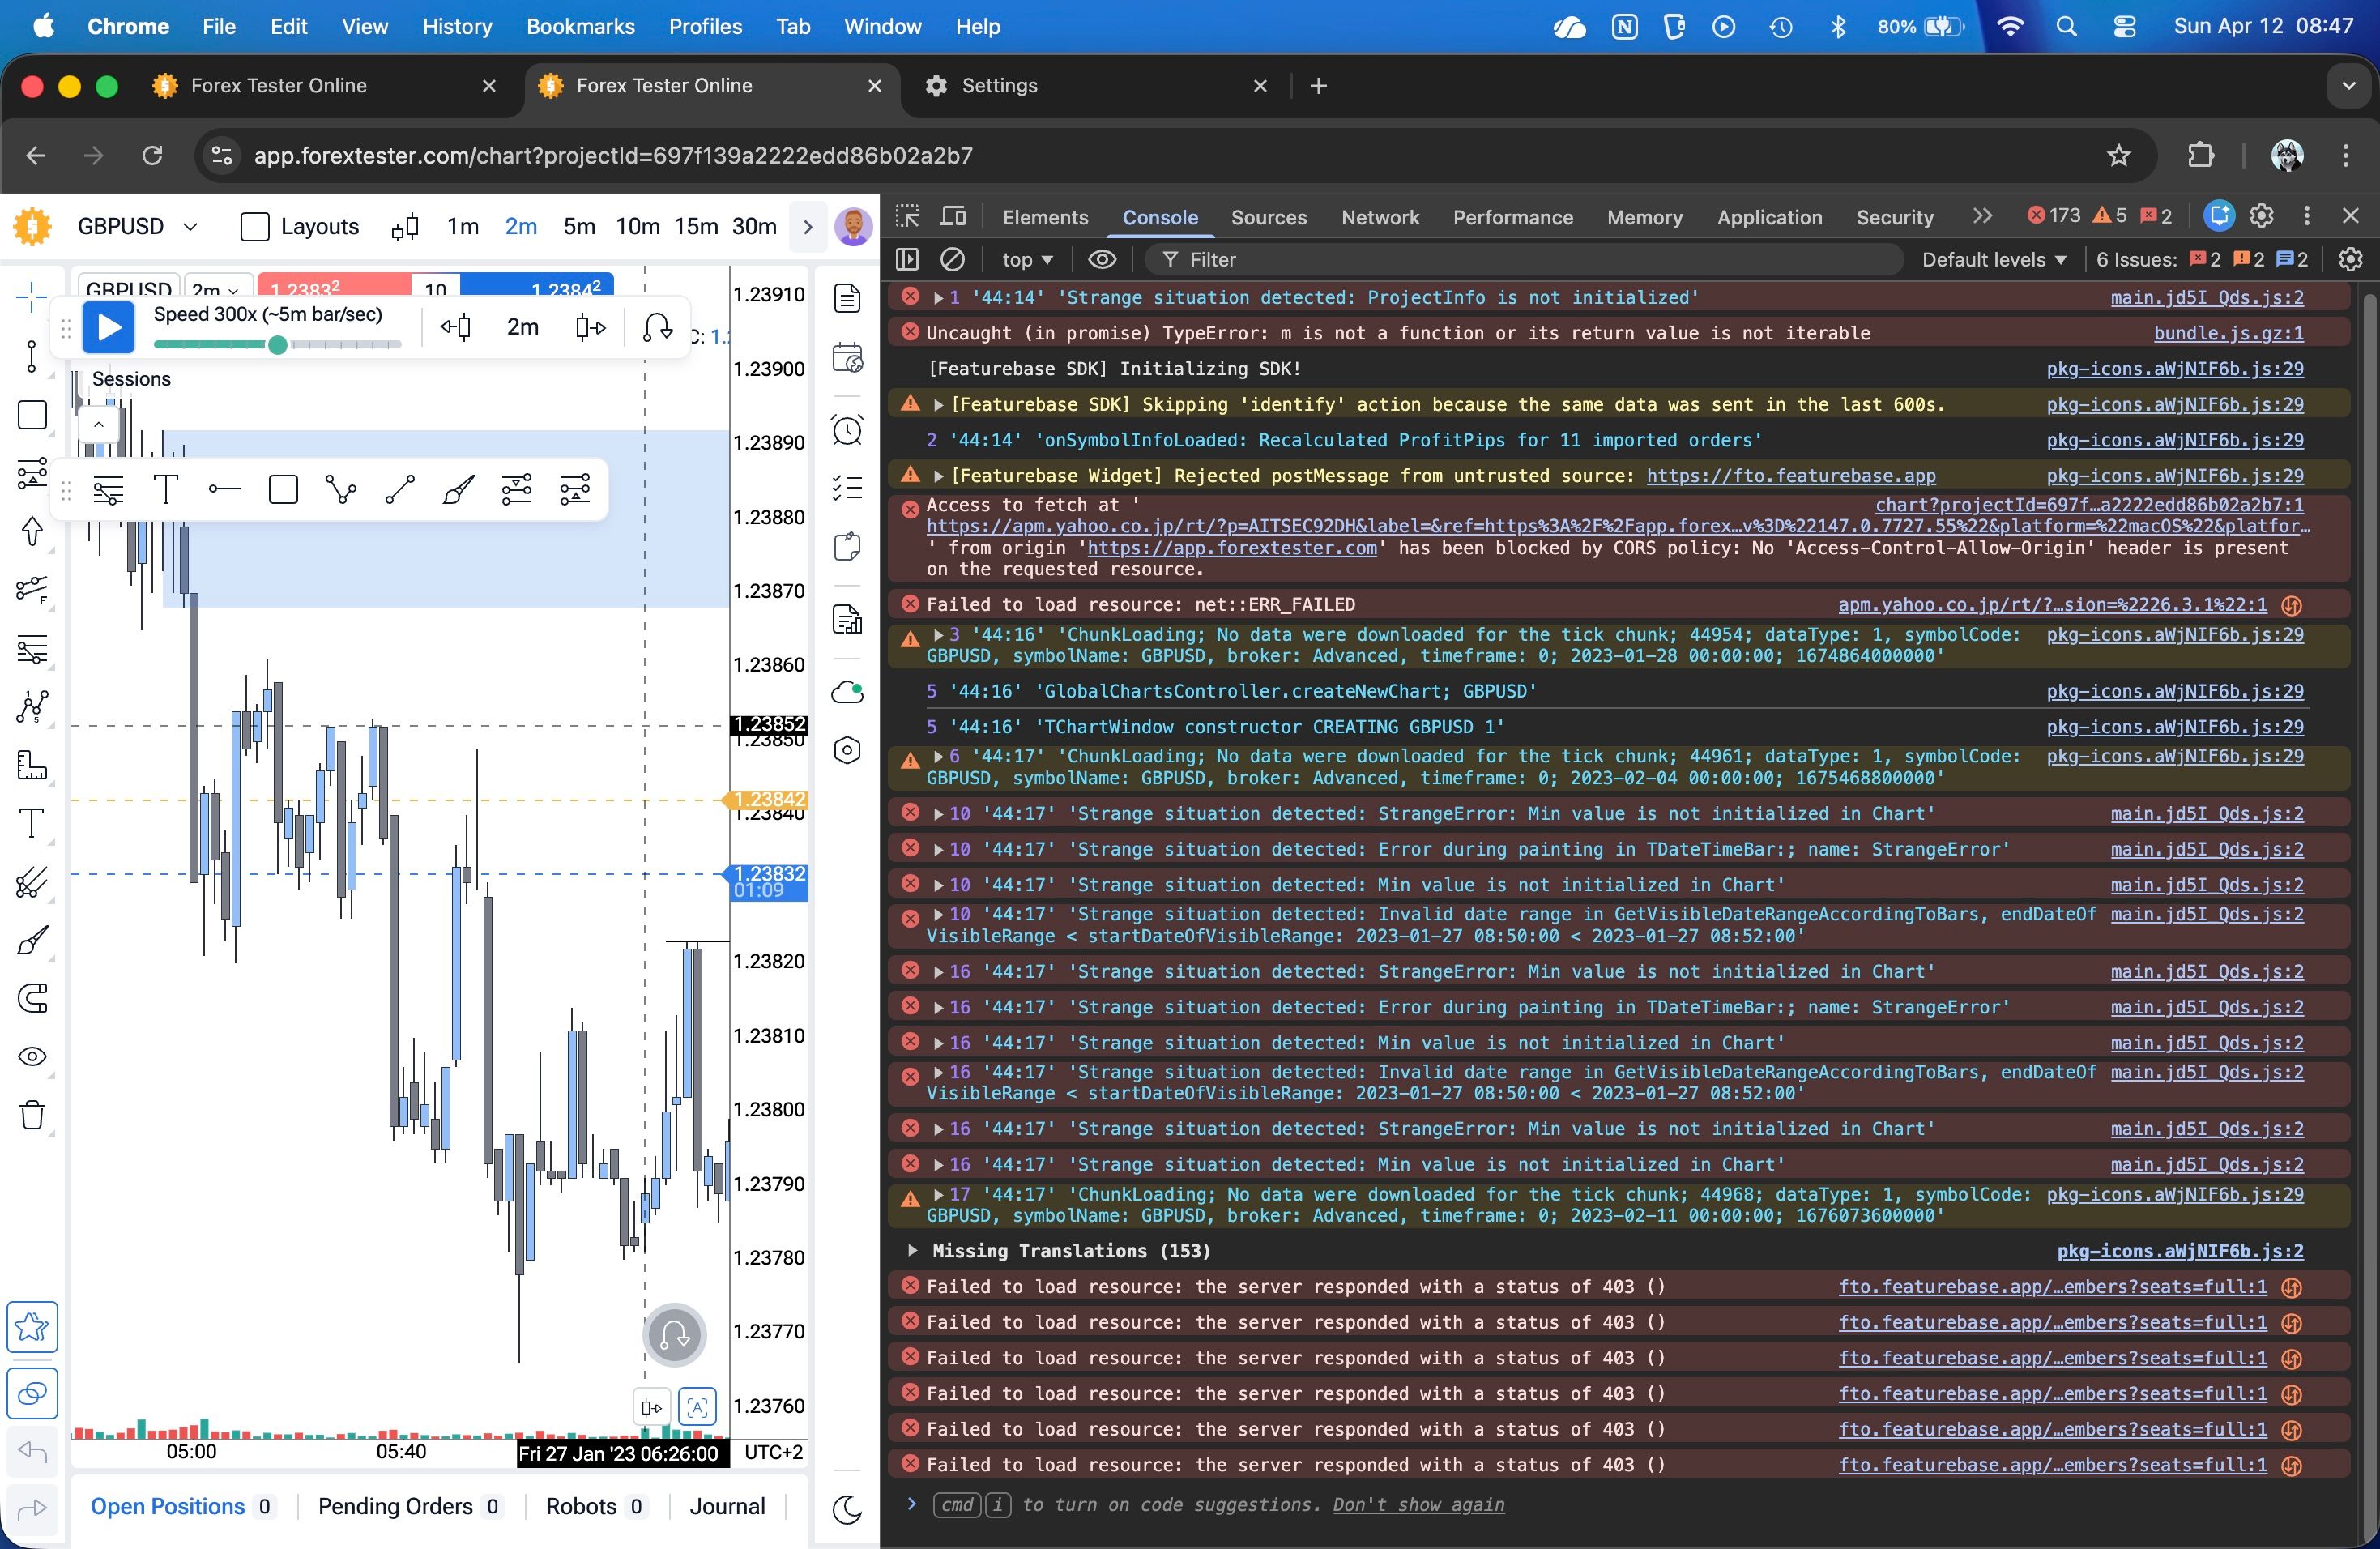
Chart jumps to 2003 when selecting the 2m TF
I have seen some other people post this issue here and I already tried the advice given to them: I reset permissions and deleted the data in the Site settings in Chrome and reloaded the site. That actually worked multiple times last week, but today it just didn’t work anymore. Attached is a view of the console tab in the F12 menu.
The issue is mainly when switching to the 2m TF. In the past another thing that worked, was switching back to some of the higher TFs like 1h, 4h, 1d (since these would show the actual date that i was backtesting) and then going back to the 2m. That also doesn’t work anymore today.
I would appreciate any help on this.
- How does this impact your experience?
Comments3
Andriy Cherniyenko
Apr 12
Hello @Noah . Do you still have this problem? I’ve tried to reproduce this issue on our side but the chart keeps showing the latest candles. I will report this issue to our developers and ask them to try to find a reason of this but and fix it in the next versions of the app.
For now, I can only recommend you clicking “Move to Last Bar“ button at the bottom right corner of the chart to quickly restore the correct chart view. Or you can press Shift + Alt + → hotkey on your keyboard to do that.
Noah
Apr 12
Hey Andriy,
Yes, it does in fact still happen, it actually happened in the last hour.
Though I feel like it’s kinda random, most of the times it works fine, until it doesn’t…
I wasn’t aware of the “Move to Last Bar“ feature. Just tried it, it’s very useful and makes the bug way less annoying. Thanks!
Serhii S.
Apr 13
Hello @Noah ,
Thanks for confirming that the issue is still happening.
I'm glad the "Move to Last Bar" feature is a helpful workaround for now.
I've forwarded your project to our development team so they can investigate what might be causing this bug.